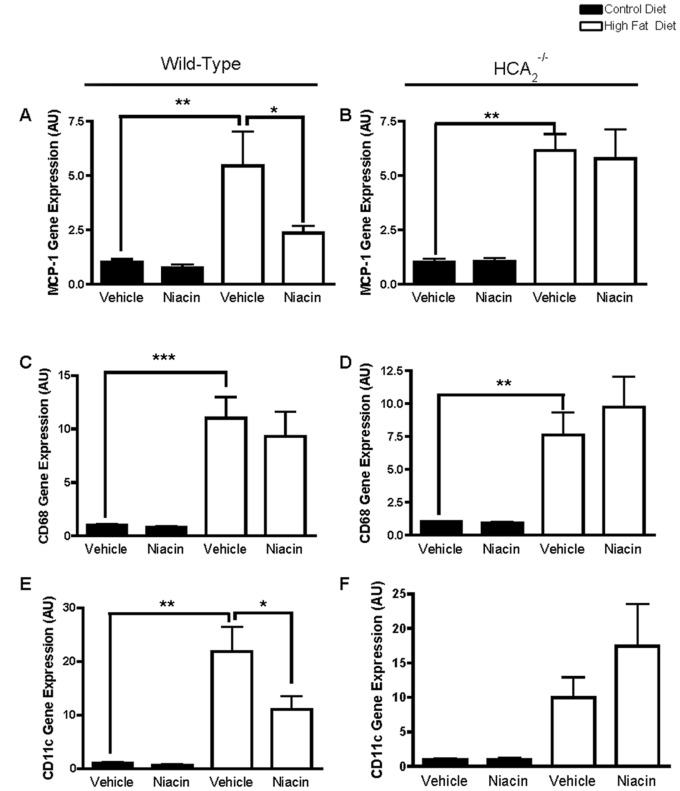
Figure 5. Effects of HFD and niacin on markers of adipose tissue inflammation.
MCP-1 gene expression in EWAT of wild-type mice (A) or HCA2 −/− mice (B), CD68 gene expression in EWAT of wild-type mice (C) or HCA2 −/− mice (D), AND CD11c gene expression in EWAT of wild-type mice (E) or HCA2 −/− mice (F). All values were normalized to 36B4; *P<0.05, **P<0.01, ***P<0.001. Data are presented as mean ± SEM and are expressed as relative to the Control group set to one. AU, arbitrary units.

