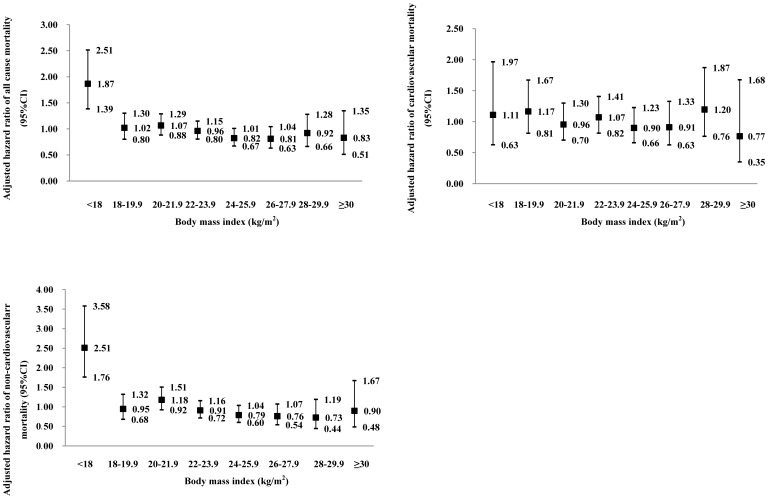
Figure 2. Multivariable-adjusted hazard ratios (95% CI) for all causes mortality, cardiovascular mortality and non-cardiovascular mortality across eight groups of body mass index (BMI).
The hazard ratio express the risk in the BMI group compared with the average risk in the whole study population, which were adjusted for sex, age, smoking, drinking, physical activity, systolic blood pressure, history of cardiovascular disorders, serum lipid disturbance, diabetes mellitus and antihypertensive drug treatment.

