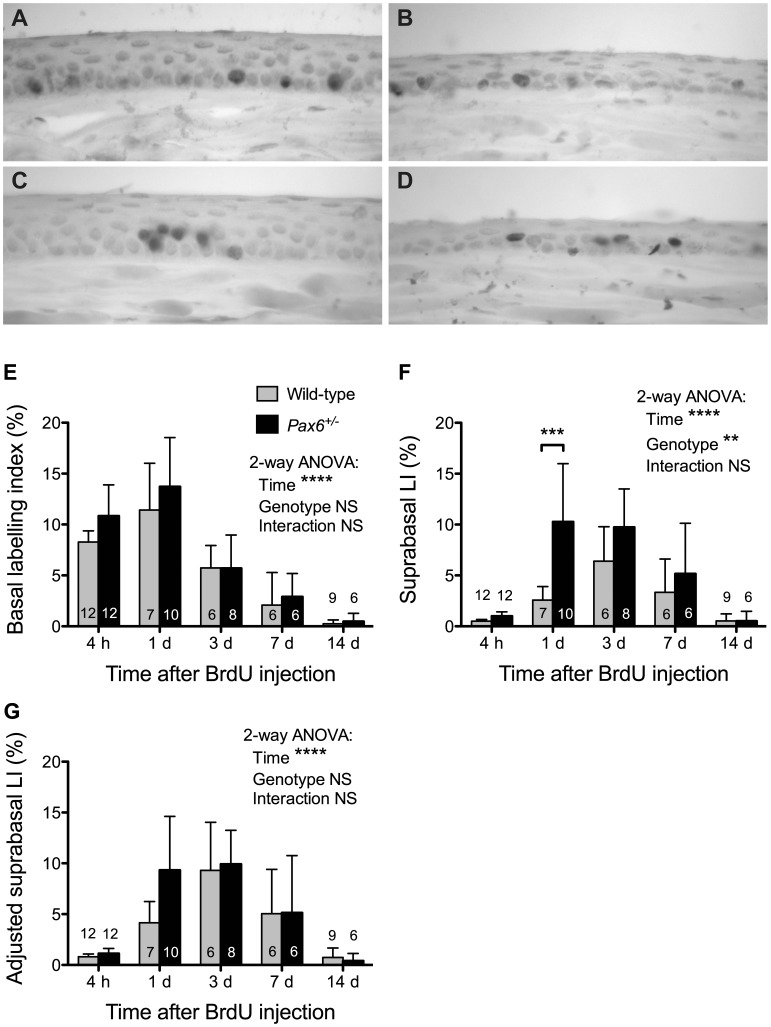
Figure 2. Acute BrdU labelling of WT and Pax6+/− corneal epithelia.
(A, B) BrdU immunohistochemistry 4 hours after BrdU injection of (A) WT and (B) heterozygous Pax6+/− mice. (C, D) BrdU immunohistochemistry 24 hours after BrdU injection of (C) WT and (D) Pax6+/− mice. BrdU-positive nuclei in the corneal epithelium appear dark. (E–G) The mean (±95% CI) BrdU labelling indices for mid-sections are shown for chase periods of 4 hours (4 h) to 14 days (14 d). (E) BrdU basal labelling index (BrdU positive basal cells as a percentage of total basal cells). (F) BrdU suprabasal labelling index (BrdU positive suprabasal cells as a percentage of total suprabasal cells). (G) Adjusted suprabasal BrdU labelling index (BrdU positive suprabasal cells as a percentage of total basal cells). Results for 2-way analyses of variance (ANOVAs) for log transformed data are shown. Where genotype differences were significant overall, pairwise comparisons were made between genotypes for each time point using Bonferroni post-hoc tests (significant differences are shown by asterisks). Separate 1-way ANOVAs and Bonferroni post-hoc tests for each genotype showed that the frequencies of BrdU-positive cells increased in the suprabasal layers from 4 h to 3 days (P<0.001 for both WT and Pax6+/− in E & F) and then declined from 3 to 14 days (P<0.001 for both WT and Pax6+/− in E & F). Abbreviations: LI, labelling index; NS, not significant; **P<0.01; ***P<0.001; ****P<0.0001. 6–12 eyes per group as shown within or above the bars.

