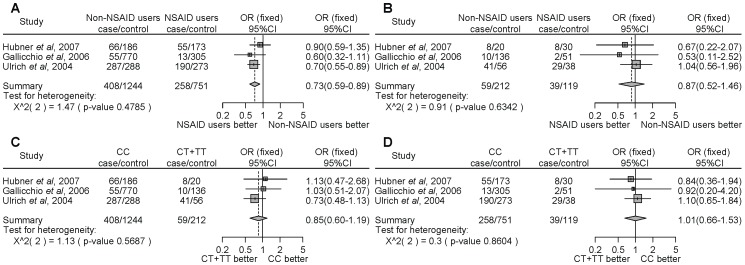
Figure 2. Forest plot of the association between the PTGS1 rs3842787 polymorphism and NSAID use on cancer risk.
The difference in the development of cancer between NSAID use and non-NSAID use from individuals homozygous for the major allele (a), between NSAID use and non-NSAID use from individuals with minor allele carriers (b), between the non-NSAID users homozygous for the major allele and the minor allele carriers (c), and between the NSAID users homozygous for the major allele and the minor allele carriers (d). Squares represent study-specific ORs; horizontal lines represent 95% CIs; size of square reflects study-specific statistical weight (inverse of the variance); diamonds represent summary OR and 95% CI.

