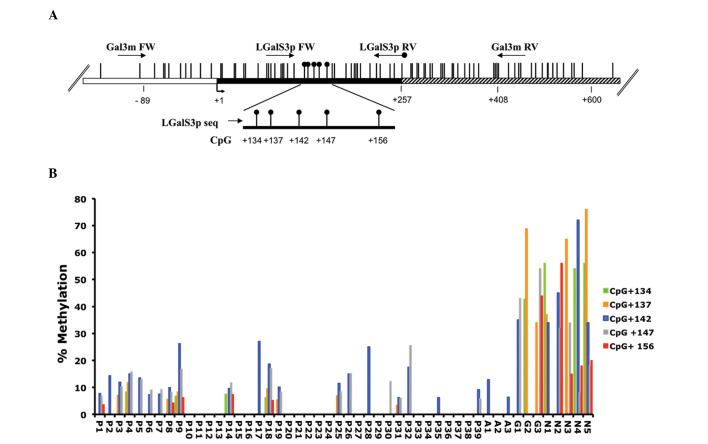
Figure 1.
Gal-3 gene methylation analysis. (A) Structure of the human Gal-3 promoter gene. The transcriptional start site (+1) is indicated by an arrow. The regulatory upstream region (white box), exons (black) and first intron (striped box) are indicated. Vertical bars represent the relative positions of each CpG site. The primer positions used for MALDI-TOF and pyrosequencing analysis are indicated by arrows (Gal3m FW/Gal3m RV and LGalS3p FW/LGalSp RV biotinylated). Black circles represent the CpG sites analyzed by pyrosequencing (CpG +134, +137, +142, +147 and +156). (B) Histogram representing the percentage of methylation of each CpG analyzed in each sample. P1-P39, papillary thyroid carcinoma; A1-A3, anaplastic thyroid carcinoma; G1-G3, thyroid goiter; N1-N5, normal thyroid; Gal-3, galectin-3; MALDI-TOF, matrix-assisted laser desorption/ionization-time-of-flight.

