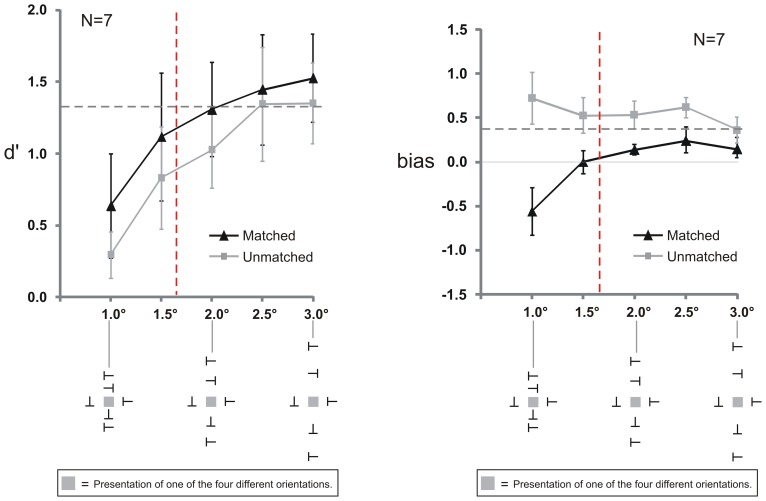
Figure 7. Results of Experiment 3A.
Left panel: Sensitivity (d′) increased with larger spacing between the target and the Vertical flankers. There was a trend for higher sensitivity in the Matched compared to the Unmatched condition but no significant difference. The dashed horizontal line indicates d′ in the baseline condition where only Horizontal flankers were presented. The red dashed vertical line shows the calculated critical spacing of the Vertical flankers where performance reached 90% – Vertical flankers did not crowd the target at spacings larger than 1.7° (to the right of the red line). Right panel: Bias differences between the Matched and Unmatched condition were observed when the Vertical flankers were presented within the critical spacing (spacing smaller than 1.7°, to the left of the vertical red line) and when they were presented outside the critical spacing (spacing larger than 1.7°) up to and including 2.5°. Both panels: The stimulus icons depict a Grouped condition with upright Vertical flankers. In the Ungrouped condition, adjacent Vertical flankers had different orientations. Stimuli are not drawn to scale. The gray squares indicate the target position and were not presented in the experiment. Error bars indicate standard errors of the mean.

