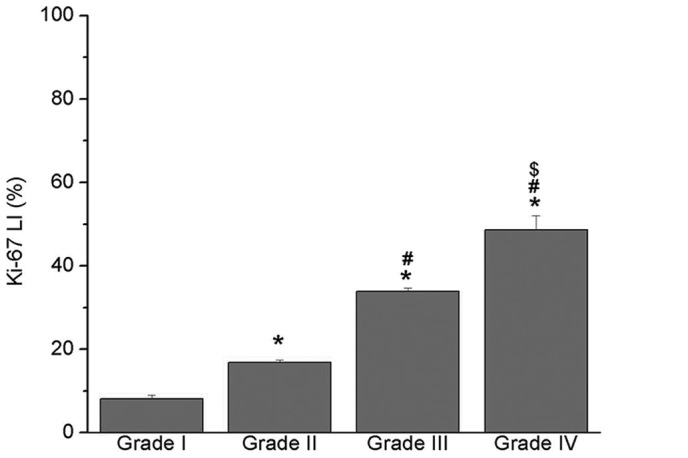
Figure 2.

Labeling index (LI) for Ki-67 in grade I, II, III and IV gliomas. Ki-67 LI was measured as the percentage of positive cells per 1,000 cells. Results are presented as mean with SE bars. *P<0.05 vs grade I, #P<0.05 vs. grade II, $P<0.05 vs. grade III.
