Figure 2.

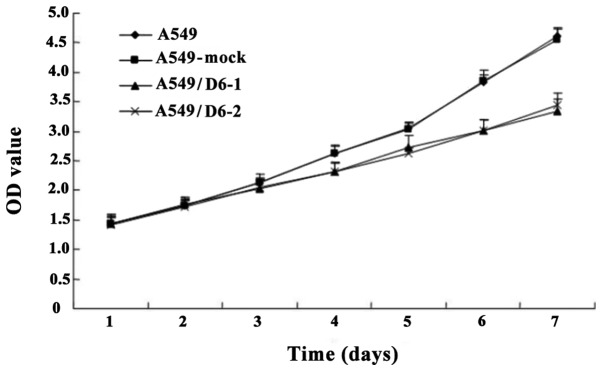
Growth curve of A549, A549-mock, A549/D6-1 and A549/D6-2 for the proliferation assay. D6 inhibits the growth of A549 cells. P<0.05 vs. A549 and A549-mock cell lines; bars, SE.

Growth curve of A549, A549-mock, A549/D6-1 and A549/D6-2 for the proliferation assay. D6 inhibits the growth of A549 cells. P<0.05 vs. A549 and A549-mock cell lines; bars, SE.