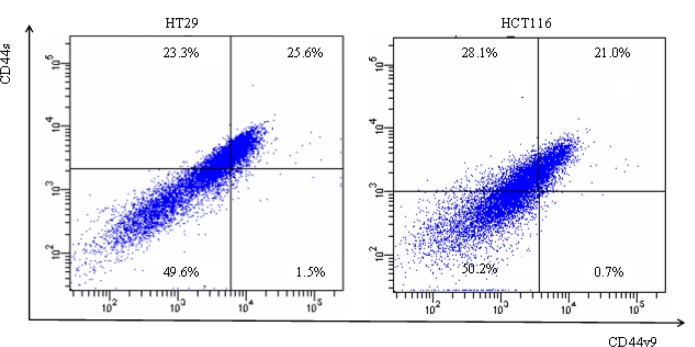
Figure 2. Flow cytometry of colon cancer cells using fluorescence anti-CD44s Ab and anti-CD44v9 Ab.
Flow cytometry was performed using colon cancer cell lines, HT29, HCT116 after they were stained for surface markers: CD44s, CD44v9. Vertical axis shows expression of CD44s, and horizontal axis showed expression of CD44v9. Three different sub populations were separated by fluorescence-activated cell sorting (FACS) as indicated: CD44s[+]v9[+], CD44s[+]v9[-], CD44s[-]v9[-].

