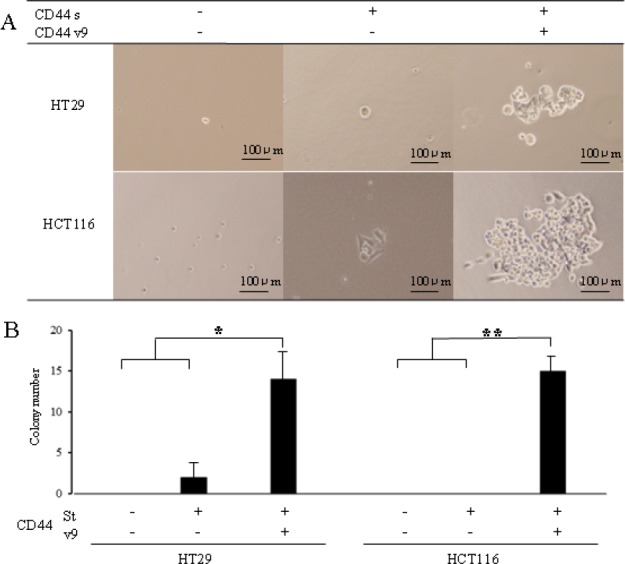
Figure 3. Colony formation in colon cancer cells expressed CD44s[+]v9[+], CD44s[+]v9[-], and CD44s[-]v9[-].

A. Microscopic view of cells after 5 days. Colon cancer cells sorted as CD44s[+]v9[+], CD44s[+]v9[-], and CD44s[-]v9[-], separated 96-well plate as 1 cell per well using dilution limited technique. B. The number of colony formations. Results are presented as the mean±SD (n=4). P values were determined using the by Student's t-test. Values of < 0.05 were considered statistically significant. *p<0.05.**p<0.01.
