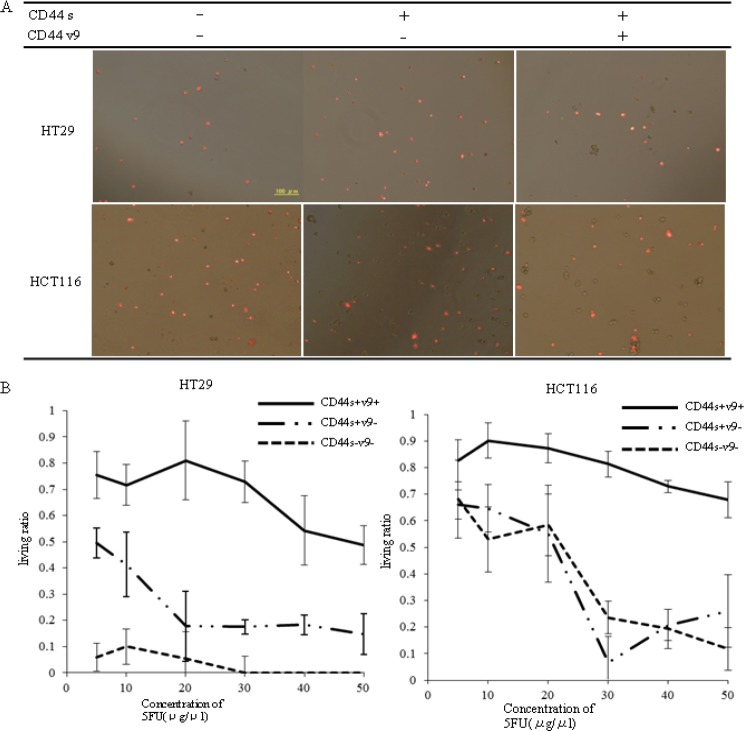
Figure 5. Evaluation of the tumorigenic potential of isolated CD44s and CD44v9 cells.
(A) Photograph of a mouse taken 4 weeks after HT29 cells transplantation. Each 1.0 × 10³ cells which sorted as CD44s[+]v9[+], CD44s[+]v9[-], CD44s[-]v9[-] were injected to NOD-SCID mouse subcutaneously. (B) Tumor volume of isolated CD44s and CD44v9 cells. The tumor size was measured with calipers, and calculated with the formula:(L × W2)/2(L; length of the tumor, W; width of the tumor). Results are presented as the mean±SD (n=4). P values were determined using the by Student's t-test. Values of < 0.05 were considered statistically significant.*p<0.01

