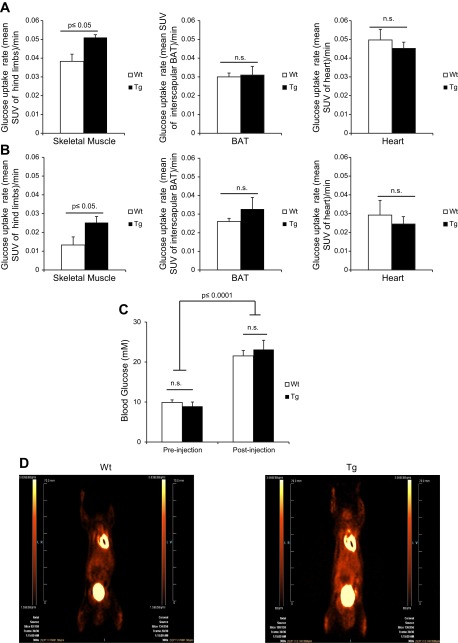
Fig. 4.
UCP1 expression in muscle increases the rate of glucose uptake. WT and Tg mice were anesthetized and injected with [18F]FDG tracer at a constant rate of infusion (1.66 μl·MBq−1·min−1) and imaged using PET for 80 min. At 20 min following injection of [18F]FDG, mice were injected with norepinephine (NE) at a dose of 1 mg/kg body wt. Pre-NE, values before NE treatment; post-NE, values after NE treatment. Mean standardized uptake values (SUV) = [18F]FDG uptake/injected activity × body weight (g/ml) as determined from regions of interest in hindlimb and forelimb muscle of Tg and WT mice. Rate of glucose uptake was measured post-NE injection. Rate of glucose uptake was determined pre-NE (A) and post-NE (B) in muscle, IBAT, and heart. C: blood glucose levels were measured pre- and postinjection of NE. Statistical analysis was done using two-way ANOVA with Fischer post hoc test; n = 5. D: coronal [18F]FDG PET images collected from WT and Tg mice; n = 5, means ± SE, Student's t-test.

