Fig. 3.
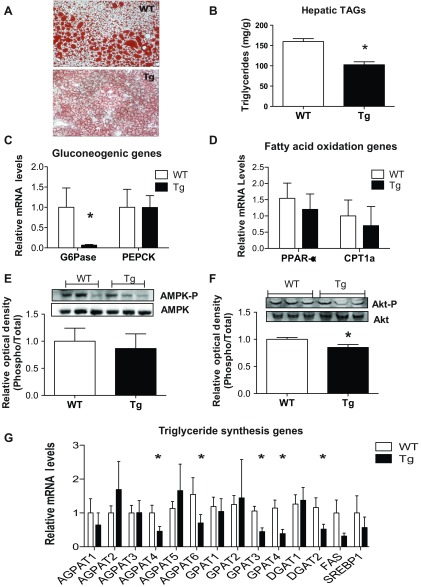
Reduced hepatic triglyceride content and synthesis in CTRP3 Tg mice. A: representative Tg and WT mouse liver sections stained with Oil Red O. B: quantification of hepatic triglyceride content. C: quantification of mRNA expression of gluconeogenic genes in liver, normalized against 18 S rRNA. D: quantification of mRNA expression of representative fatty acid oxidation genes in liver, normalized against 18 S rRNA. E and F: quantitative immunoblot analysis of liver AMPKα (Thr-172) (E) and Akt (Ser-473) (F) phosphorylation in WT and Tg mice. G: quantification of mRNA expression of enzymes involves in triglyceride synthesis. All data are reported as comparisons between WT and Tg mice on an HFD (n = 8–10 per group). Phosphorylated protein levels were normalized to total protein levels. All data are reported as means ± SE. *P < 0.05 vs. WT.

