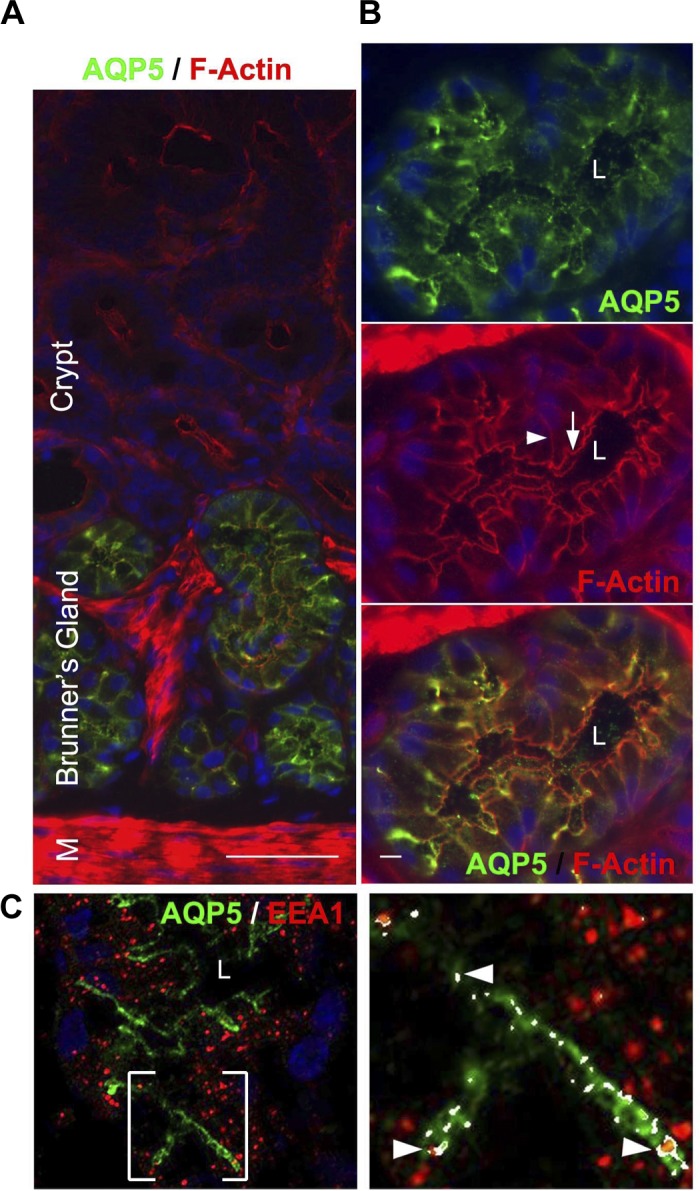
Fig. 4.

Distribution of aquaporin 5 (AQP5) in rat Brunner's glands. Cryostat sections of rat proximal duodenum were immunolabeled with antibodies against AQP5, F-actin, and/or EEA1 and viewed by confocal microscopy as described in materials and methods. A: low-magnification image of immunolabeled section shows the distribution of AQP5 (green) and F-actin (red) along the Brunner's gland-crypt axis. B: high-magnification image of a single Brunner's gland shows the distribution of AQP5 (top, green) in the apical domain and F-actin (middle). Merged image shows areas of AQP5/F-actin colocalization (bottom). White arrow indicates apical membrane. White arrowhead indicates basolateral membrane. C: image of a single Brunner's gland showing the distribution of AQP5 and EEA1 (left); enlarged area shows colocalization (right, arrowheads). Hoechst stain labels the nuclei blue. Scale bar = 10 or 100 μm.
