
Fig. 8.
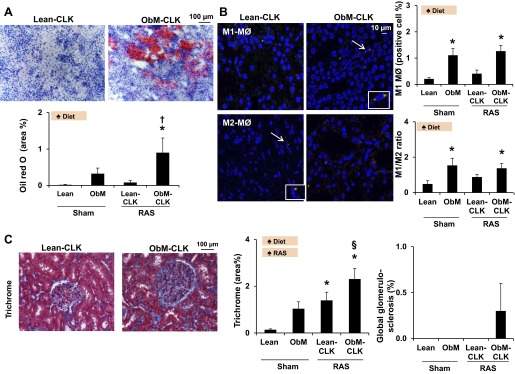
Renal fat deposition, MØ phenotype, and fibrosis in sham and the contralateral kidneys (CLK) of Lean and ObM pigs with renal artery stenosis (n = 7 each group). A: representative kidney oil-red-O staining images (×20) and its quantification showed increased fat deposition in ObM-CLK. B: representative images (×40) of immunofluorescence staining for M1- and M2-MØ [CD163 red, M1-(iNOS) or M2 (arginase-1) green, double staining yellow] and quantifications for M1-MØ-positive cells and the M1/M2-MØ ratio. As opposed to Fig. 4, the increase in the M1/M2 ratio in ObM-sham reached statistical significance because of the different groups involved in analysis. C: representative trichrome images (×20) and quantifications for tubulointerstitial fibrosis and glomerulosclerosis. ♠Diet: significant effect of the ObM diet; ♠RAS: significant effect of RAS (2-way ANOVA). * P ≤ 0.05 vs. Lean-sham; §P < 0.05 vs. ObM-sham; †P < 0.05 vs. Lean-CLK.