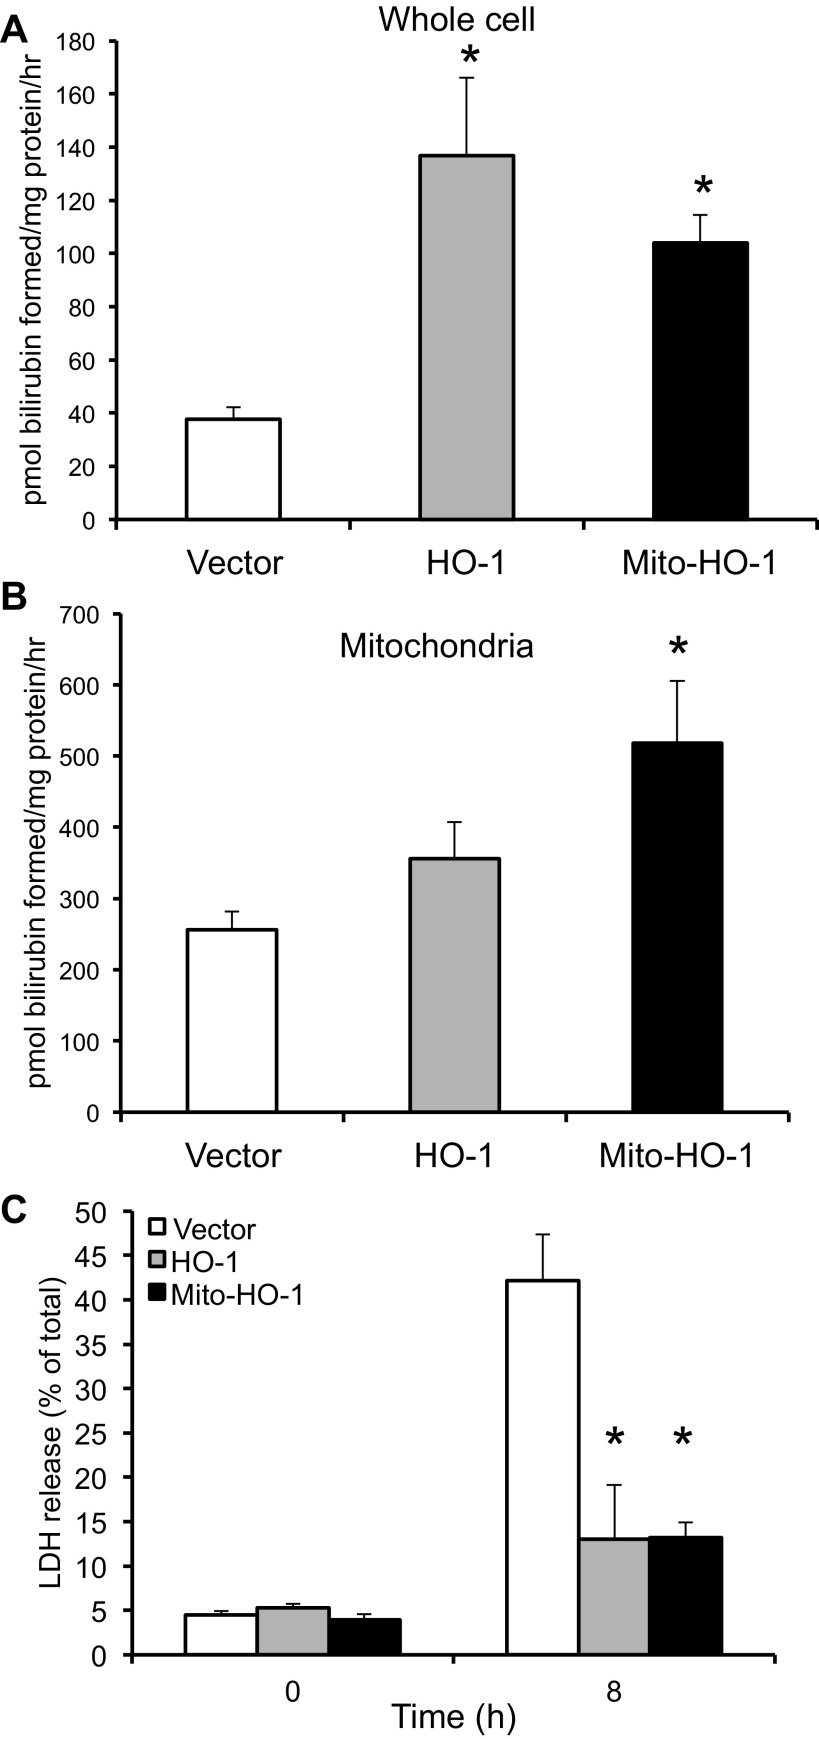
Fig. 3.
Functional assessment of targeted HO-1 expression. A and B: HO activity was determined by measuring the amount of bilirubin formed per mg protein in whole cell lysates and mitochondria and expressed as pmol bilirubin formed per mg protein. *P < 0.05 compared with vector cells. C: cells were treated with 100 μM heme for 8 h, and %cytotoxicity was evaluated by measuring lactate dehydrogenase (LDH) release. *P < 0.01 compared with vector cells treated with hemin.

