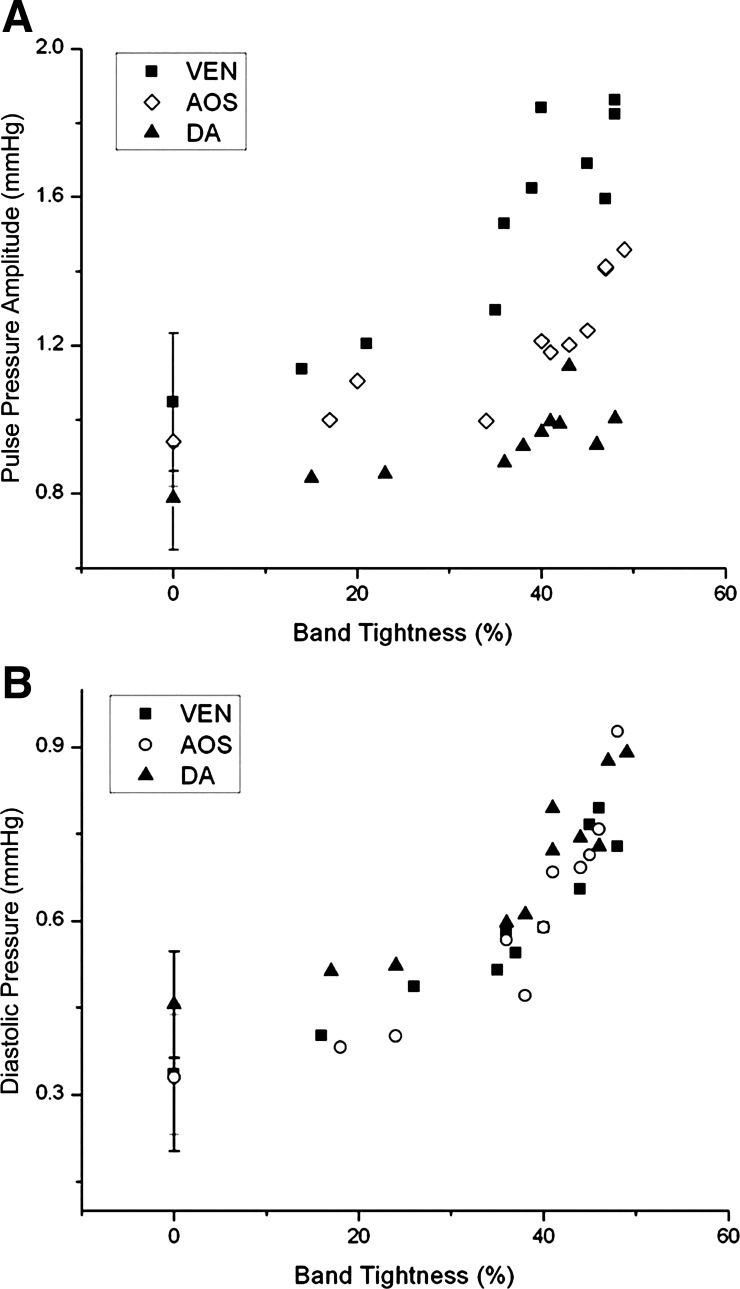
Fig. 5.
Blood pressure increases in response to band tightness. A: pulse pressure amplitude (ΔP) as a function of band tightness. B: minimum (diastolic) pressure versus band tightness. Blood pressure is shown for the ventricle (VEN), AOS, and DA of HH18 chick embryos 2 h after banding. The data shown include 8 embryos with band tightness from 35% to 50% (used to generate the data shown in Table 1), 2 embryos with band tightness from 10% to 30%, and averages and SDs from 8 control embryos (0% band tightness).

