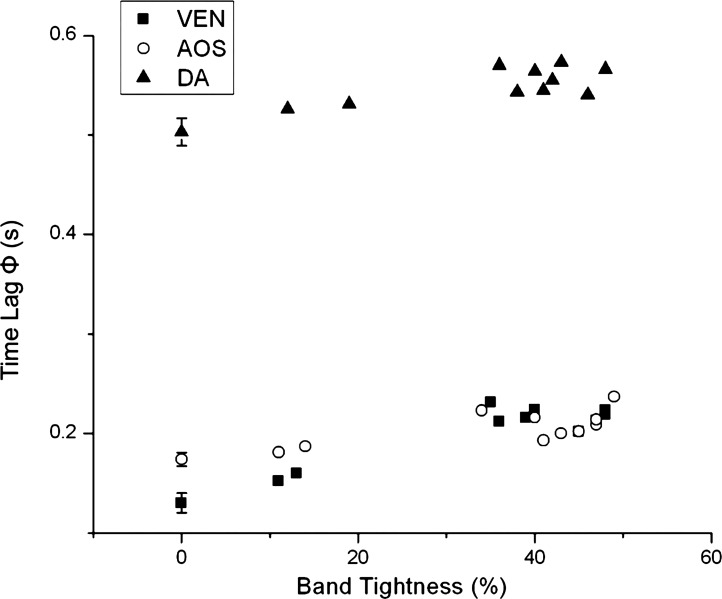
Fig. 6.
Values of Φ for blood pressure to peak after cardiac depolarization as a function of band tightness. Results are from the same embryos shown in Fig. 5; thus, the data correspond to blood pressure in the ventricle, AOS, and DA of HH18 chick embryos after 2 h of banding.

