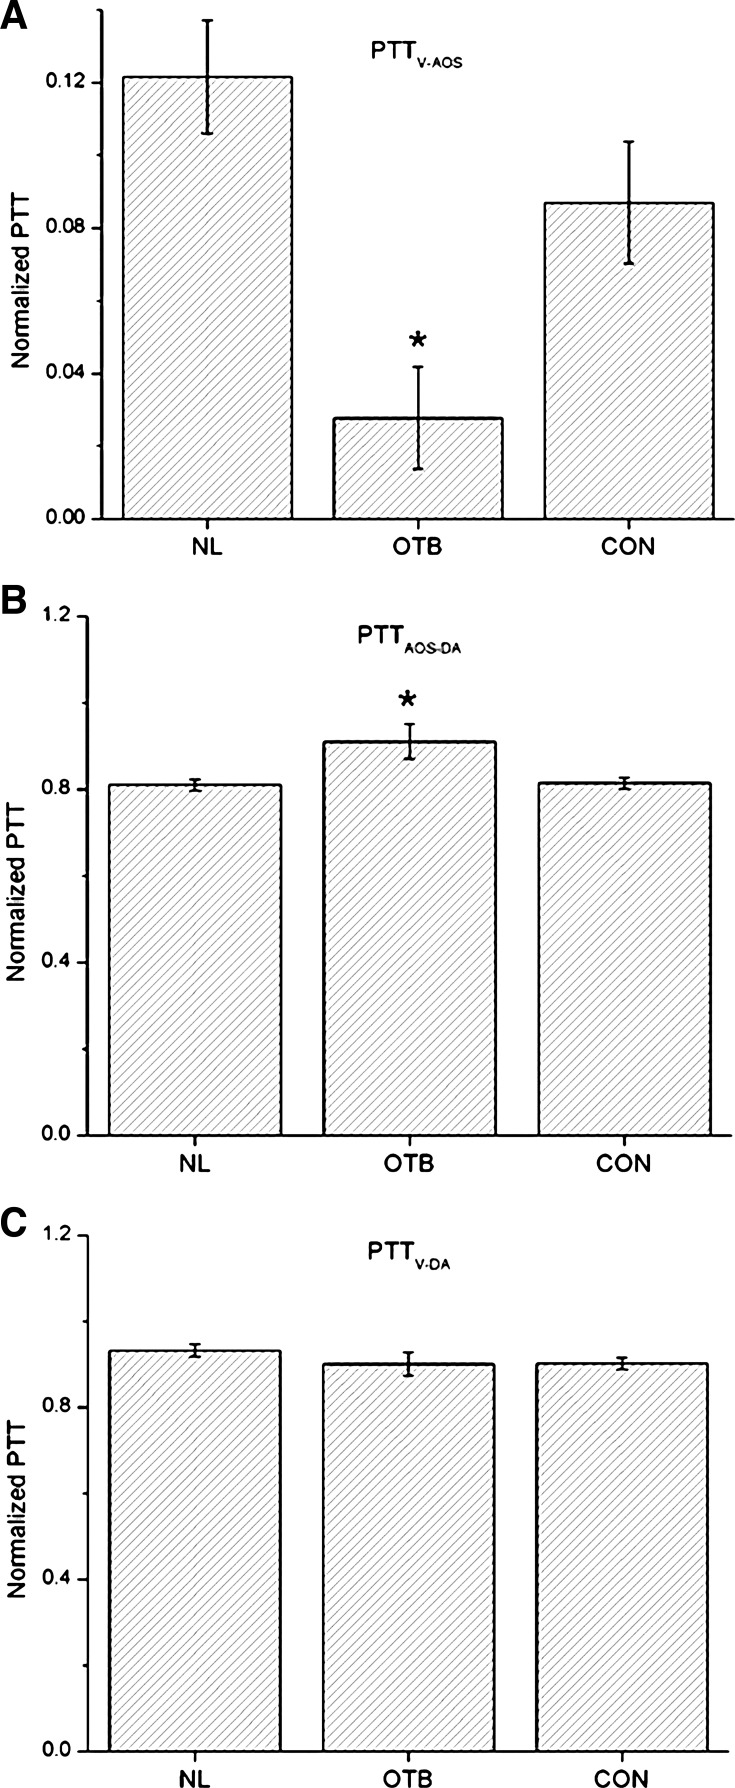
Fig. 8.
Comparison of normalized PTT (NP = PTT/T) obtained from simultaneous ECG-pressure measurements in HH18 chick embryos. A: NP between the ventricle and AOS (PTTV-AOS/T). B: NP between the AOS and DA (PTTAOS-DA/T). C: NP between the ventricle and DA (PTTV-DA/T). Results are shown as averages ± SD. Data are shown for the three groups of embryos considered: normal (NL), OTB (35–50% band tightness), and CON. *P < 0.05, statistically significant difference with respect to NL and CON embryos.

