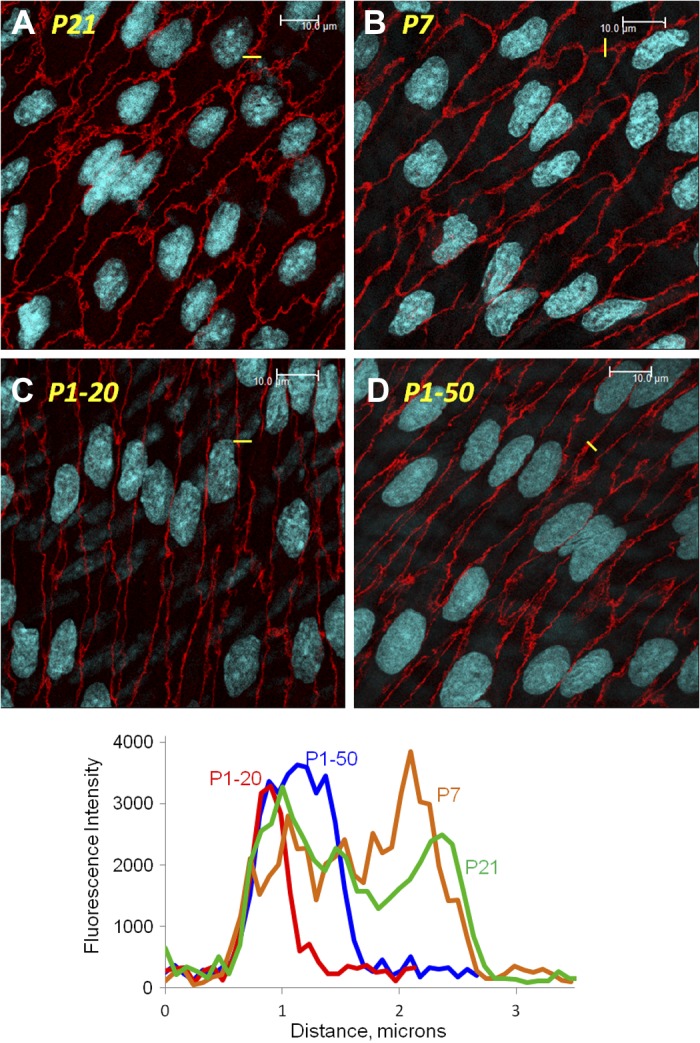
Fig. 7.

Representative LSM fluorescent images demonstrating the staining of VE-cadherin (red) and the organization of endothelial adherens junctions in P21 (A), P7 (B), and P1 (C, D) arteries. P1 arteries were assessed after they had been maintained at a transmural pressure (PTM) of 20 mmHg (C) or after PTM was transiently increased (50 mmHg, 60 min) before returning to 20 mmHg for analysis (D). The white line represents 10 μm. As described in materials and methods, the width of adherens junctions was determined by constructing region of interest (ROI) grids, comprising 4 lines 15 μm apart, which were placed perpendicular to the long axis of endothelium that had been stained for VE-cadherin. The width of adherens junctions was determined as the distance in μm that VE-cadherin intensity was above the immediate background level. An example of a small component of a ROI grid overlaying a single junction is shown in yellow in each image and the corresponding intensity profiles presented in the bottom graph [red P1–20, P1 arteries, which were maintained at 20 mmHg; blue P1–50, P1 arteries that were exposed to a transient increase in PTM (50 mmHg, 60 min); brown, P7 arteries; green, P21 arteries].
