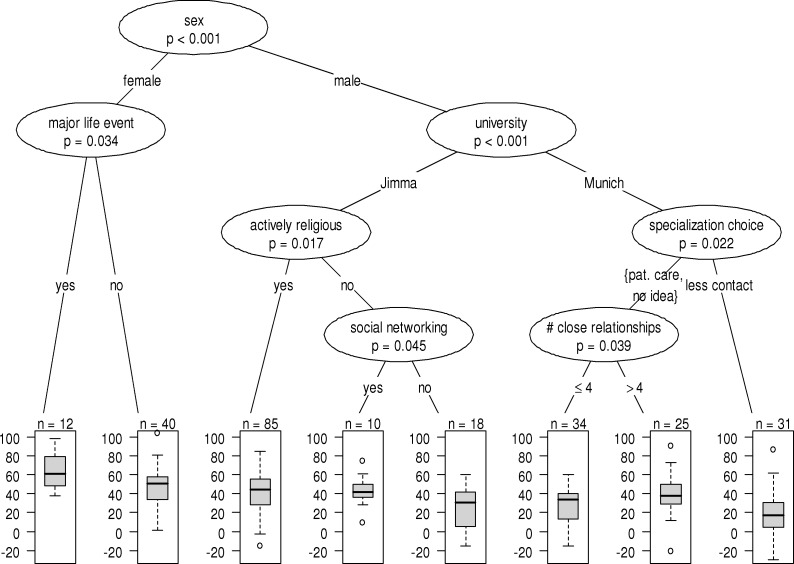
Figure 1.
Regression tree for the Balanced Emotional Empathy Scale (BEES) on the basis of sociodemographic and cultural characteristics. Here, a p value corresponds to a permutation test on differences in the BEES with respect to the conducted binary split. The boxplots show the distributions of the BEES in the subgroups resulting from the recursive partitioning.

