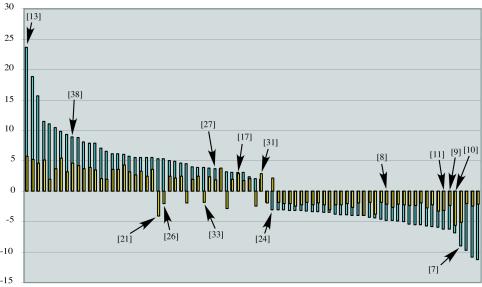
FIG. 4.
Graphical representation of the relative magnitudes of microarray-predicted changes in transcript accumulation for the 80 identified virus-common C. parasitica-responsive genes (from Table 1). Blue-shaded bars indicate the magnitude of transcript accumulation change following CHV1-EP713 infection (fold change [y axis]), whereas the magnitude of change for the same genes after CHV1-Euro7 infection is indicated by the yellow-shaded bars. Specific genes tested by real-time RT-PCR are indicated by bracketed numbers that refer the reader to data listed in Table 3.

