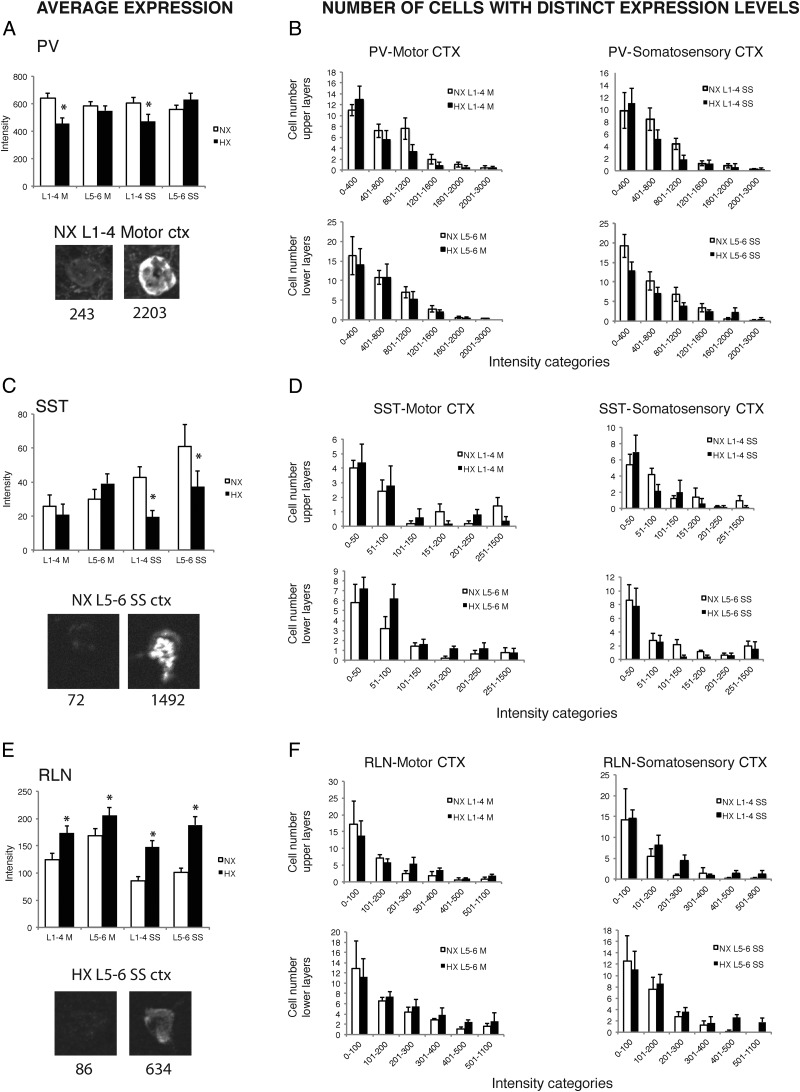
Figure 4.
Intensity and distribution of expression of interneuron marker expression in upper (L1–L4) and lower (L5–L6) layers of primary motor or primary somatosensory cortex (hindlimb) of normoxic and hypoxic mice at P47. Quantification of average expression and numbers of cells with distinct expression levels, respectively, with regards to PV (A, B), SST (C, D), and RLN (E, F). Asterisks denote significant differences (p < 0.05) as determined by factorial ANOVA conducted for each marker. Images depict representative examples of single cells expressing low or high levels of a given marker. The numbers signify the background corrected intensity of cell fluorescence for each cell and marker. NX, normoxia; HX, hypoxia; M, motor cortex; SS, somatosensory cortex; L1–4, cortical layers 1–4; L5–6, cortical layers 5 and 6; ctx, cortex.

