Figure 1.

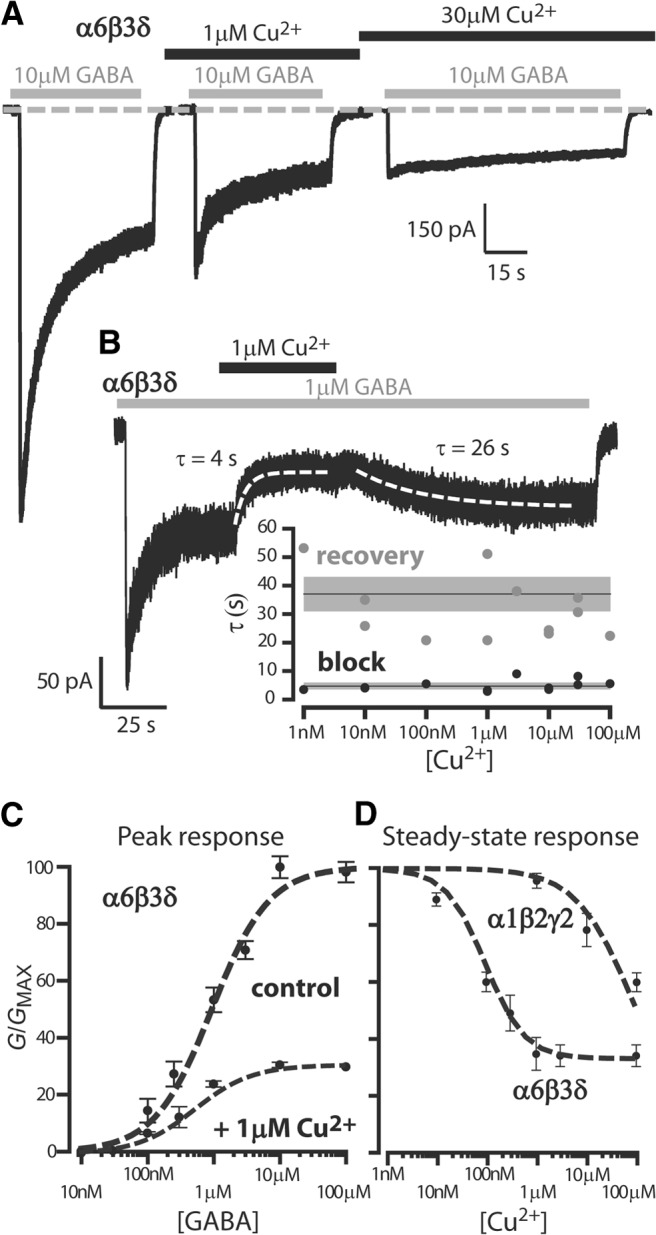
High-affinity Cu2+ block of GABAARs. A, Whole-cell voltage-clamp traces during 10 μm GABA applications to HEK-293 cells expressing α6β3δ subunits. In control conditions (left trace), GABA resulted in a clear peak response that desensitized to a steady-state level. Prior application of 1 μm Cu2+ (middle trace) resulted in an attenuated peak and steady-state response. Higher concentrations of Cu2+ (right trace) resulted in a GABA response that exhibited little desensitization because of the large attenuation of the peak response. B, A whole-cell response to 1 μm GABA (gray bar) and coapplication of 1 μm copper (black bar). The Cu2+ block was rapid and well described by a single exponential function with a time constant of 4 s. Recovery from block was slower and described by a single exponential function with a time constant of 26 s. The speed of block and recovery was estimated at varying Cu2+ concentrations. The data plotted in the inset to B demonstrate that the Cu2+ concentration does not influence the speed of block or recovery. The solid lines indicate the average kinetics, and the shaded areas represent the SEM. C, GABA dose–response curves constructed from the peak response (G/GMAX) recorded in the presence and absence of 1 μm Cu2+. The mean peak conductance ± SEM are plotted and data fitted with a Hill equation (dashed line). D, Plot of the average steady-state conductance (G/GMAX) ± SEM obtained in response to a 1 μm GABA application at a range of Cu2+ concentrations. The dashed lines are the results of a fit using the Hill equation to compare the potency of Cu2+ block for two GABAA receptor types. The IC50 estimate for α6β3δ subunit-containing GABAARs was 65 nm compared with 85 μm for α1β2γ2s subunit-containing GABAARs.
