Figure 2.
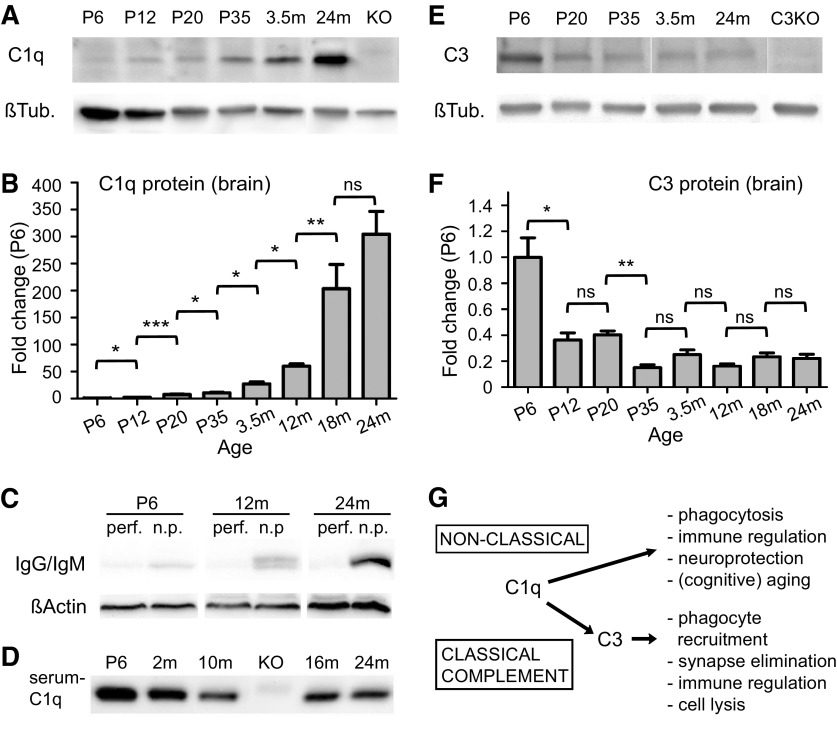
C1q protein levels dramatically increase with aging in the murine brain. A, Western blot analysis of perfused, whole-brain homogenates using a commercially available anti-mouse C1q polyclonal antibody confirmed that C1q protein dramatically increased with aging in the murine brain, when compared with β-tubulin (βTub) loading controls. C1q signals detected were specific (KO, C1q-deficient brain homogenate). B, Quantification of Western blot signals, normalized to β-Tub loading controls, confirmed that C1q protein dramatically increased with age (C1q levels, normalized to P6 levels, n = 3 animals/age; statistical significance: P12 vs P6: p = 0.019; P20 vs P12: p = 0.0005; P35 vs P20: p = 0.019; 3.5 months vs P35: p = 0.043; 12 vs 3.5 months: p = 0.012; 18 vs 12 months: p = 0.0017; 24 vs 18 months: p = 0.104). C, Serum components IgG and IgM were only detected in nonperfused (n.p.) but not in perfused (perf) brains at all ages. D, C1q immunoreactivity did not increase with age in mouse serum (equal protein concentration loaded). E, Western blot analysis of perfused, whole-brain homogenates revealed that C3 immunoreactivity did not increase with age, compared with the β-Tub loading controls. C3 signals were specific (C3KO, C3-deficient brain homogenate). F, Quantification of Western blot-derived C3 signals, normalized to β-Tub loading controls, confirmed that C3 protein decreased from early postnatal ages to approximately 1 month of age and after (C3 levels, normalized to P6 levels, n = 3 animals/age; statistical significance: P12 vs P6: p = 0.029; P20 vs P12: p = 0.434; P35 vs P20: p = 0.003; 3.5 months vs P35: p = 0.07; 12 vs 3.5 months: p = 0.18; 18 vs 12 months: p = 0.50; 24 vs 18 months: p = 0.88.). G, Schematic overview of the known classical complement (C3)-dependent and nonclassical (C3-independent) functions of C1q (Ricklin et al., 2010; Veerhuis et al., 2011; Nayak et al., 2012; Stephan et al., 2012). m, Month; ns, not significant; *p < 0.05, **p < 0.01, ***p < 0.001. Values and error bars represent mean ± SEM.

