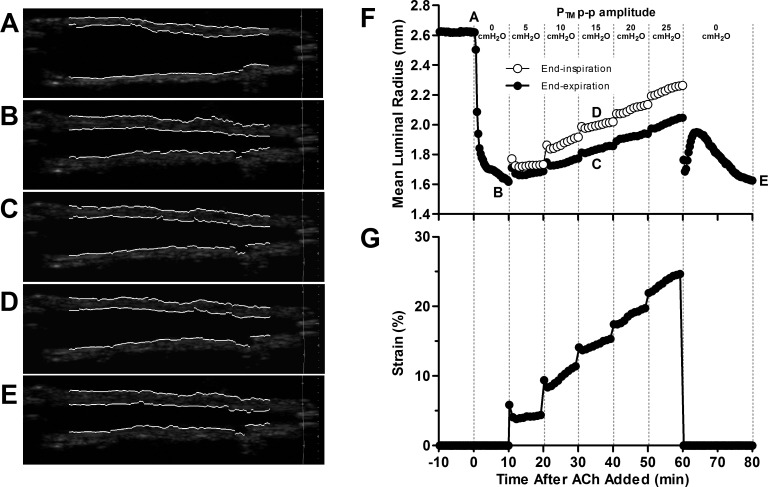
Fig. 3.
Representative trace of airway's mean luminal radius (F) and strain amplitude (G), along with processed ultrasound images (A–E) corresponding to five distinct points along these curves during protocol 1, with Ptm oscillations applied above a Ptm simulating a normal FRC. At position A, the intact airway is in a relaxed state at its baseline radius. A moderate dose of ACh (10−5 M) was then added to bath, and the airway narrows for 10 min to its statically constricted radius at position B. Ptm oscillations of increasing p-p amplitude (5–25 cmH2O) were then applied. The mean luminal radius at a Ptm corresponding to FRC (5 cmH2O, ●) and end-inspiration (○) were extracted from the ultrasound images. Representative images are shown during 15-cmH2O Ptm p-p amplitude oscillations at end-expiration (position C, Ptm = 5 cmH2O) and end-inspiration (position D, Ptm = 20 cmH2O). Following the largest amplitude oscillation, the perturbations were stopped, and the airway was held statically for 20 min, returning to its final steady-state radius at position E. Small tidal Ptm oscillations (5-cmH2O p-p amplitude) provide minimal bronchodilation, despite 4% strain. The airway dilates more as the Ptm p-p amplitude and strains increase.

