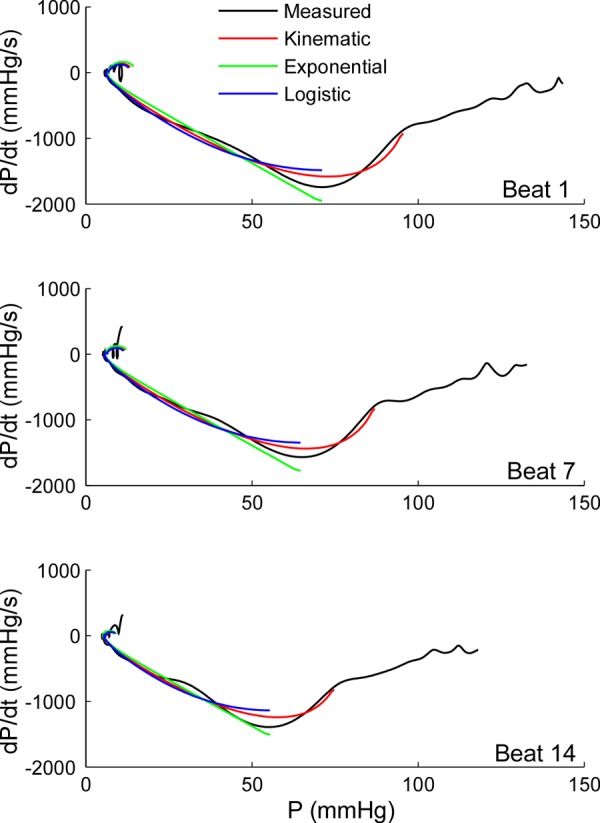
Fig. 5.

Alternative mathematical model fittings for pressure data during isovolumic relaxation shown in the pressure phase plane. The results of adjusting pressure-time data using the optimization algorithm implementing different relaxation functions are shown in a representative animal data set of 14 beats obtained during IVC occlusion. Active relaxation is described using the exponential (Eq. A1, green), the logistic (Eq. A9, blue), and the kinematic models (Eq. A10, red), overlaid on measured pressure (black, from peak LV pressure to end diastole). In the pressure-phase plane, these models are depicted as linear, one parameter curvilinear, and two parameter curvilinear, respectively. Beats 1, 7, and 14 are shown. Notice that, by design, the optimization algorithm estimates a single set of relaxation parameters [τ, τ-logistic, and μ (resistive parameter equivalent to τ) and Ek (lumped elastic parameter accounting for the elastic restoring force)] for the exponential, logistic, and kinematic models, respectively, from the 14 beats in the data set. Thus individual beat fitting results are necessarily worse than if each beat were fitted independently. dP/dt, minimal derivative of LV pressure with respect to time.
