Fig. 6.
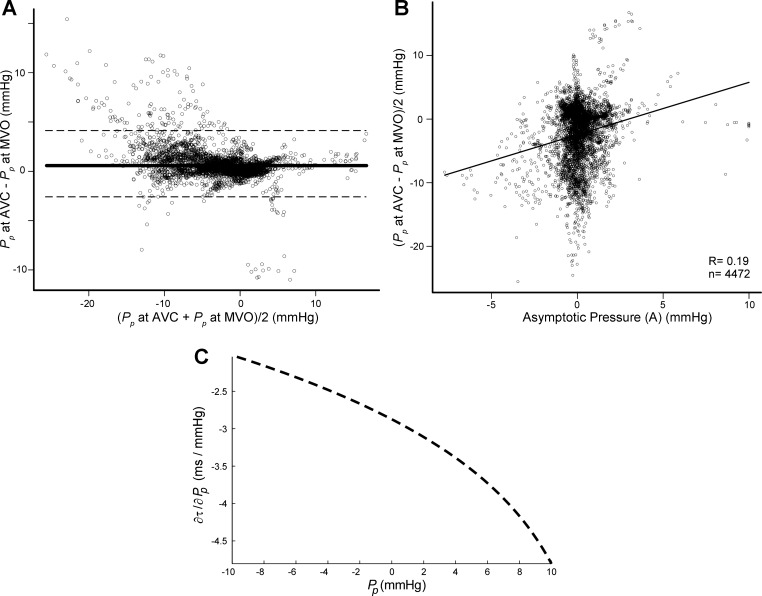
Impact of passive pressure during the isovolumic phase on the estimation of relaxation. A: Bland-Altman plot of pooled data of all beats from all animal experiments showing the bias (solid line) ± SD (dashed line) showing the individual variation of passive pressure from AVC to MVO. The lack of full agreement demonstrates volume-mediated changes in passive pressure in this phase. B: scatterplot between asymptotic pressure obtained by single-beat analysis using Eq. A7 (horizontal axis) and average isovolumic passive pressure obtained by the global optimization method (vertical axis). The lack of correlation demonstrates the limitations of the conventional method for measuring relaxation to accurately uncouple passive pressure during the isovolumic phase. C: impact of the uncertainty of estimating passive pressure during the isovolumic phase for the characterization of relaxation using the conventional exponential method (Eq. A7 analytic derivative solved for a τ value of 50 ms and P0 of 80 mmHg). Notice that 1-mmHg error in the estimation of Pp induces an error up to 4.5 ms in measured τ. As shown in B, these errors are frequently much higher. We believe that this mechanism may partially account for the preload dependence of relaxation previously reported using the conventional single-beat isovolumic method.

