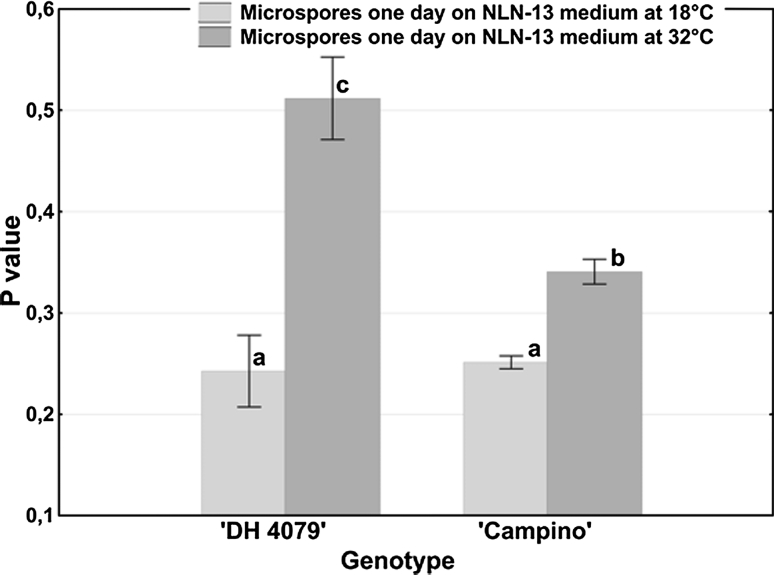
Fig. 2.
Plasma membrane fluidity (P value) in B. napus microspore suspensions dependent on the temperature of culture incubation. The fluidity of plasma membranes was estimated using fluorescence dye DPH. Mean values ± standard errors are presented in the graph. Mean values marked with the same letter do not differ significantly according to Duncan’s multiple range test (P < 0.05)

