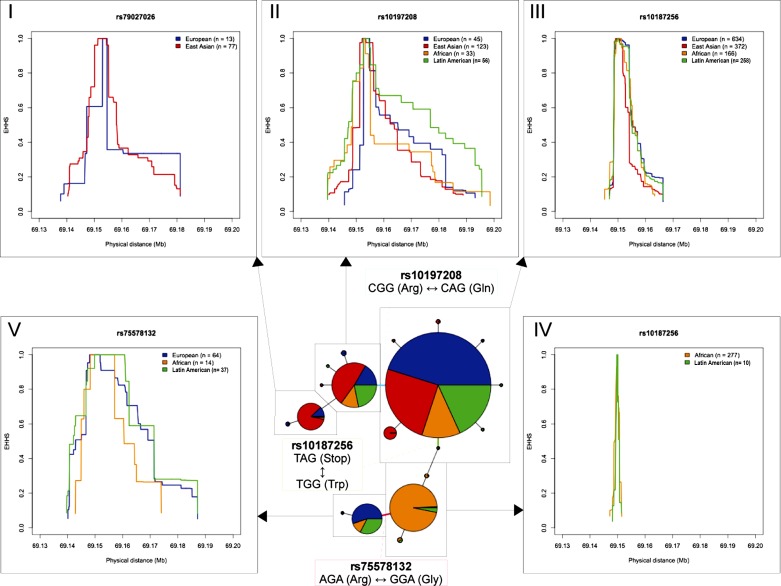
Fig. 9.
The extended haplotype homozygosity of SNP (EHHS) profiles of the different haplotypes define patterns of selection. Using the coding haplotype network (derived in Fig. 7D), we created EHHS plots. As mentioned previously, the lines between nodes in the haplotype network represent mutations. We have labeled mutations, rs10187256 being representative, that define the differences between the major coding haplotypes. The 5 surrounding line charts (I–V) are EHHS profiles calculated for the 5 major haplotype sets in the network, scaled identically for comparison. Arrows are shown to connect EHHS plots with their respective haplotype sets in the network. Curves represent the decay of haplotype homozygosity within each set, centered around the SNP indicated in each chart title. Curves are colored to represent the different continental regions, using the same color scheme as the haplotype network and indicated in the legends, as are haplotype sample sizes.

