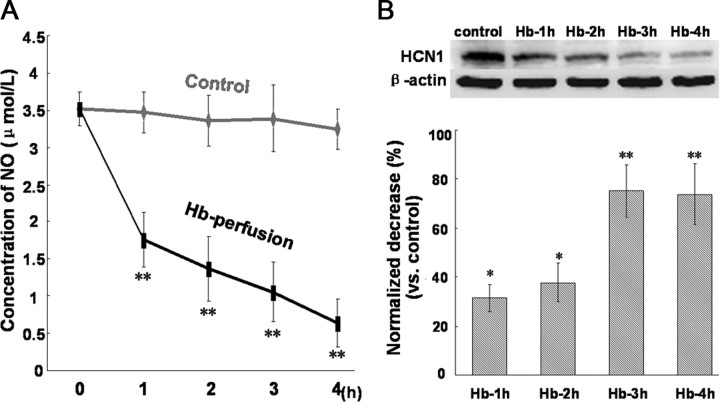
Figure 4.
Changes of NO level in hippocampus slices and HCN1 expression in CA1 region during Hb perfusion. A, Concentration of NO released from CA1 slices at 1, 2, 3, and 4 h after Hb perfusion. n = 5 rats per group. B, Western blot for HCN1 in CA1 slices at 1, 2, 3, and 4 h after Hb perfusion. The expression levels are expressed as a ratio of β-actin levels for normalization. n = 5 rats per group.

