
Fig. 3.
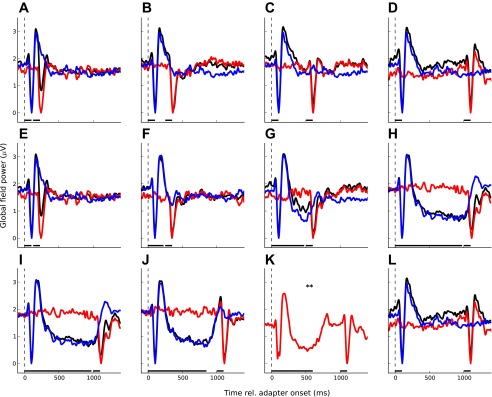
Grand-average responses for experiment 1. Each panel shows 1 experimental condition; the top (A–D) shows the conditions with varying SOA (experiment 1A; see Fig. 1A), the middle (E–H) shows the conditions with varying adapter Dur (experiment 1B; Fig. 1B), and the bottom (I–L) shows the conditions with varying ISI (experiment 1C; Fig. 1C). The stimulus timing is indicated by the black bars above the abscissa. As in Fig. 2, the black lines show the responses to the adapter-probe pairs, the blue lines show the responses to the adapter in isolation, and the red lines show the probe responses. In the 400-ms ISI condition (K; indicated by **), the response to the adapter was not measured separately because the adapter response did not overlap the probe response and measuring it would have added another condition. A and E, D and L, and H and I represent identical conditions and thus show the same data. The adapter responses in isolation in A–D are also the same.