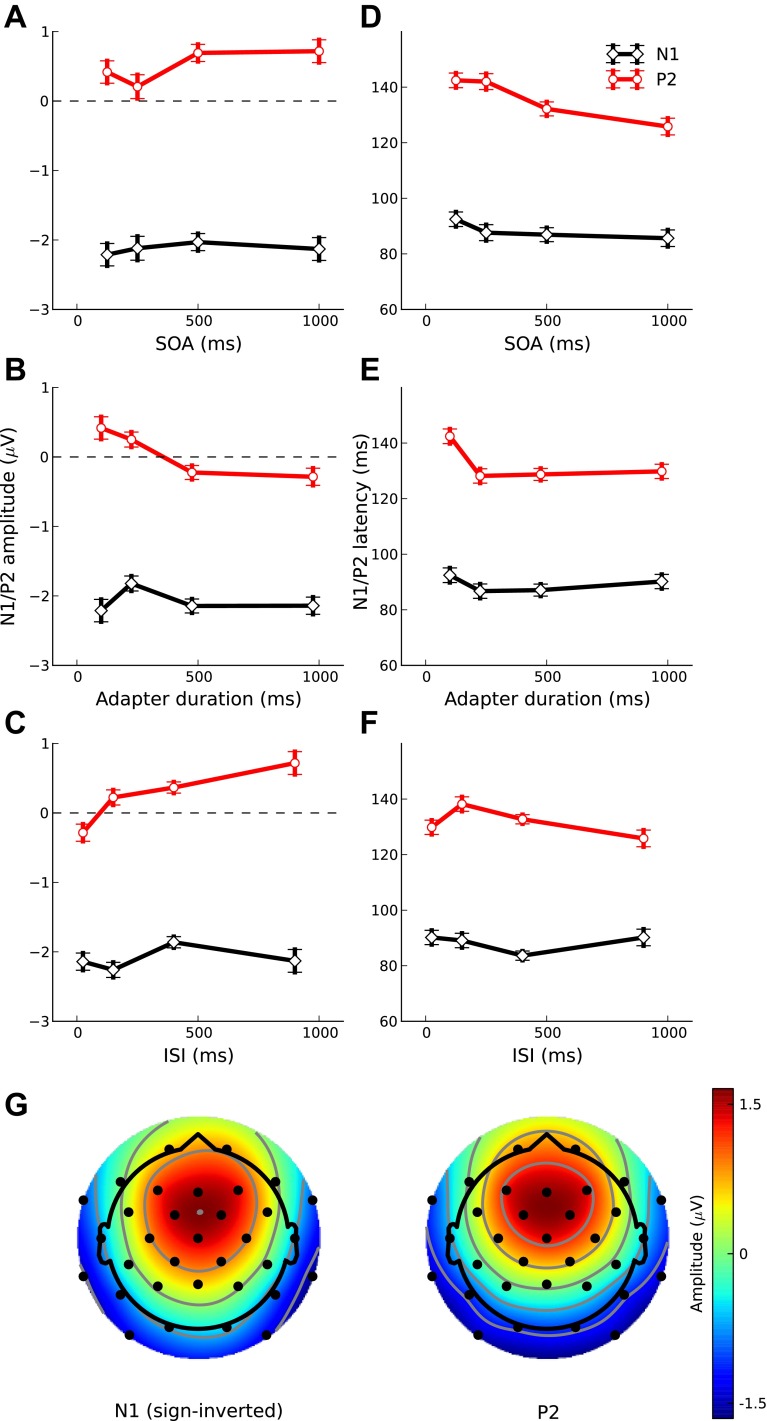
Fig. 6.
Dependence on SOA (top), adapter Dur (middle), and ISI (bottom) of the N1 (red symbols and lines) and P2 (black) deflections in the probe response. The left (A–C) shows the average peak amplitudes and the right (D–F) the latencies of the deflections. The error bars show the SE. G shows the scalp topographies of the N1 (left) and P2 (right), derived by averaging over the 20-ms time windows around the N1 and P2 peaks in the grand-average response to the adapters in isolation. The N1 topography was sign-inverted to account for the polarity difference between the N1 and P2.

