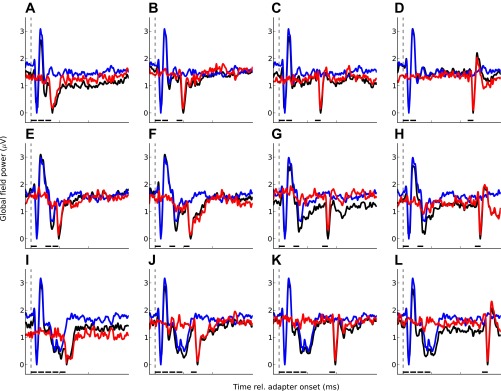
Fig. 7.

Grand-average responses for experiment 2. As in Fig. 3, each panel shows 1 experimental condition; the top (A–D) shows the 2-fast conditions (see Fig. 1D), the middle (E–H) shows the 2-slow conditions (Fig. 1E), and the bottom (I–L) shows the 4-fast conditions (Fig. 1F). The stimulus timing is indicated by the black bars above the abscissa. The black lines show the responses to the adapter and probe sequences, the blue lines show the responses to the adapter trains in isolation, and the red lines show the probe responses.
