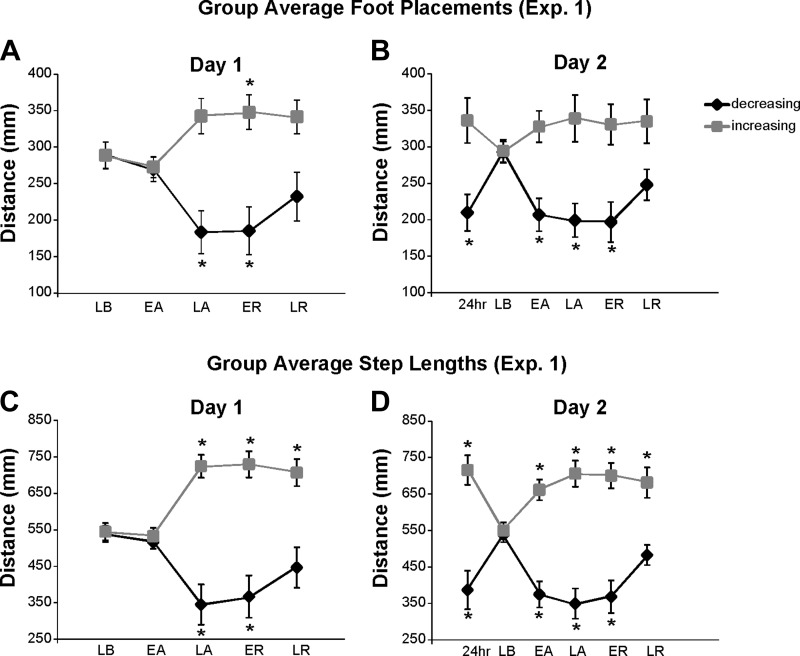
Fig. 4.
A and B: experiment 1 group average forward foot placements during all key epochs of day 1 (A) and day 2 (B). C and D: experiment 1 group average step lengths during all key epochs of day 1 (C) and day 2 (D). For all, black diamonds represent the decreasing leg and gray squares represent the increasing leg. Error bars show ±1 SE. Asterisks indicate significant differences from the late baseline epoch based on post hoc analyses.

