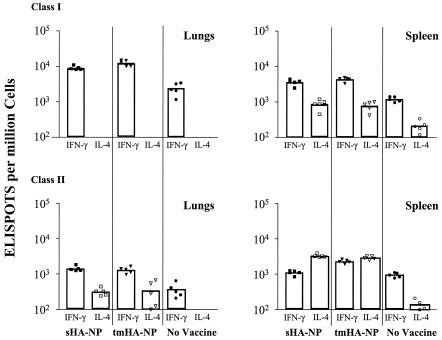
FIG. 3.
ELISPOT analyses of responding T cells. Lung and spleen cells from influenza-challenged mice were stimulated with class I or class II NP peptide, and ELISPOTS for both IFN-γ and IL-4 were performed, as previously described (12). Symbols indicate data for individual mice, and the bars show data for the average of five mice per group. Immunogens are indicated at the bottom of the figure, and tested lymphokines are shown below the data bars.

