
Fig. 4.
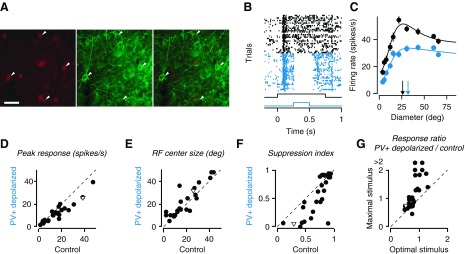
Parvalbumin-expressing (PV+) interneurons influence spatial integration. A: cell-type specific expression of channelrhodopsin 2 (ChR2) in PV+ interneurons: PV immunostaining (left), ChR2-EYFP expression (middle), and overlay (right). Scale bar, 50 μm. B: raster plots of responses to a grating of 15.5° without (black) and with (blue) optogenetic depolarization of PV+ interneurons (black trace, visual stimulus; blue trace, photostimulation) (unit 36-2.7.11). C: size tuning curves; same conventions and example unit as in B. Arrows depict RF center size. D–F: changes in peak firing rates (D), RF center size (E), and suppression strength (F) with optogenetic depolarization of PV+ interneurons. G: ratio of responses with and without photostimulation to optimal and maximal stimulus size. In D–G, inverted triangle depicts example unit from B and C.