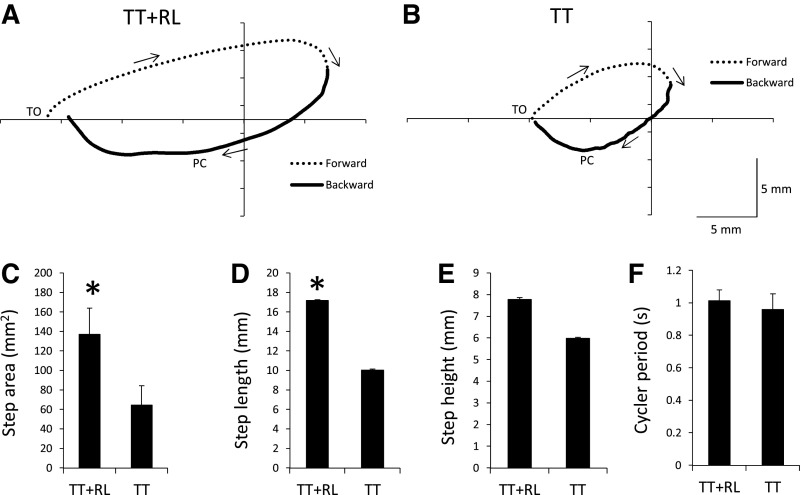
Fig. 3.
The ankle trajectory during stepping is shown for the TT+RL (A) and TT (B) groups. Data from tests performed on week 4 were used to generate the average trajectory for each group (n = 8 in each group). Forward and backward movements of the ankle during the step cycle are indicated by the dashed and solid lines, respectively. Arrows show direction of ankle movement. TO and PC indicate approximate occurrences of toe off and paw contact, respectively. Plots of step area (C), step length (D), step height (E), and cycle period (F) are shown for the TT+RL and TT groups. Mean + standard errors are shown (n = 8 in each group) and were generated from data collected during week 4 tests. *Significant difference between the TT and TT+RL groups (P < 0.05).

