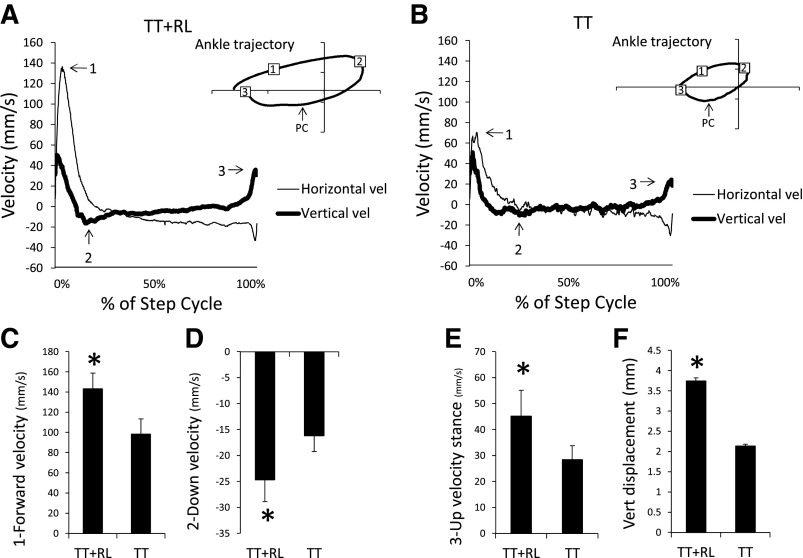
Fig. 4.
The velocity of the ankle is shown for the TT+RL (A) and TT (B) groups. Horizontal and vertical velocities (vel) are indicated by the thin and thick lines, respectively. Data from tests performed on week 4 were used to generate the average trajectory for each group (n = 8 in each group). 1, 2, And 3 indicate maximum forward velocity, maximum downward velocity, and maximum upward velocity and correspond to the numbers shown in ankle trajectory. In the ankle trajectory, PC indicates approximate occurrence of PC. Plots of maximum forward velocity (C), maximum downward velocity (D), maximum upward velocity (E), and vertical (Vert) displacement during stance (F) are shown for the TT+RL and TT groups. Mean + standard errors are shown (n = 8 in each group) and were generated from data collected during week 4 tests. *Significant difference between the TT and TT+RL groups (P < 0.05).

