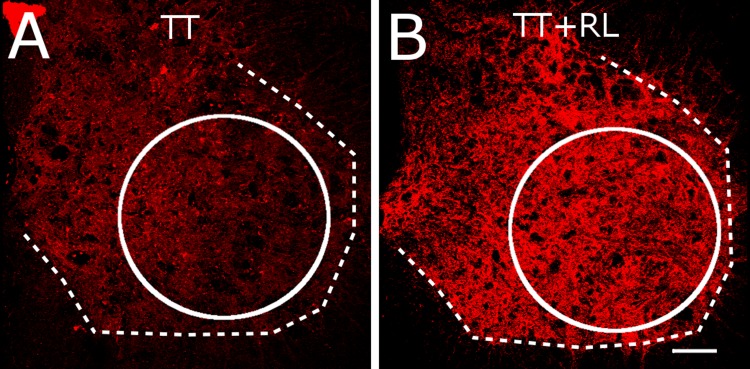
Fig. 5.
Synaptophysin label in the ventral horns of the lumbar spinal cord in representative TT (A) and TT+RL (B) rats are shown. The dashed lines indicates approximate boundary between gray and white matter. The circle indicates the area of the ventral horn that was used in analyses. Calibration bar is 150 μm.

