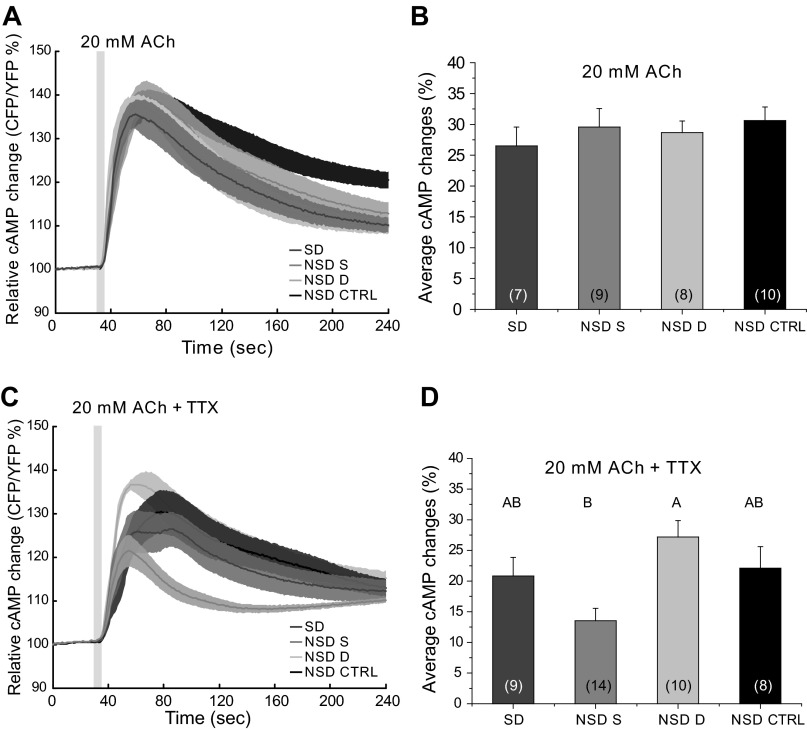
Fig. 6.
The response of EB neurons to ACh stimulation is not affected by SD. A: responses of EB neurons to ACh following SD were not different from responses of non-SD flies. Light gray box on figure represents the duration of stimulation. B: bar graph shows the average response for all conditions tested (1-way ANOVA, P = 0.7255). C: adding 1 μM TTX to the bath did not alter the response to ACh following SD. Light gray box on figure represents the duration of stimulation. D: bar graph shows the average response for all conditions tested (1-way ANOVA, P = 0.0044). Numbers in parentheses represent the number of preparations for each condition. Data are expressed as means ± SE. Different letters represent different significance groups.

