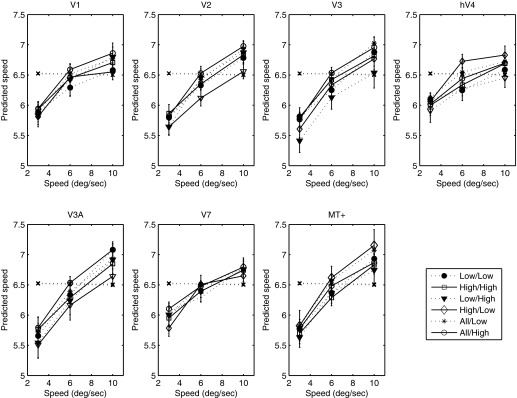
Fig. 5.

Predicted speed of the classifier as a function of stimulus speed is plotted for high (open symbols) and low (closed symbols) luminance and for low-high and high-low training regimes in experiment 2. Broken lines represent classifier performance for random assignment of speeds. Cortical area is indicated above each panel. Error bars represent ±1 SE.
