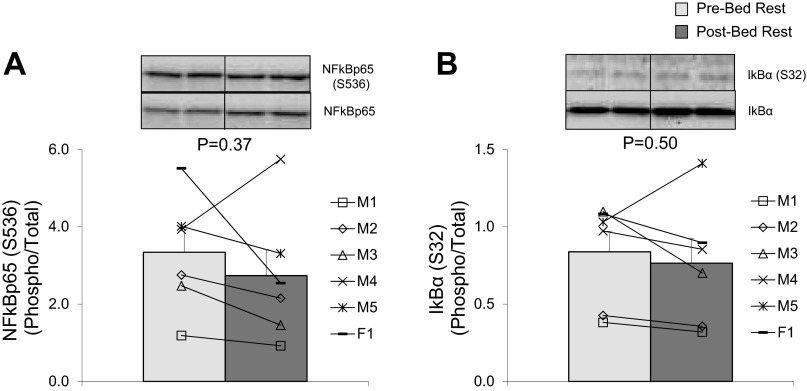
Fig. 2.
Effect of bed rest on nuclear factor-κB (NF-κB) signaling. Data represent NF-κB phosphorylation (S536) relative to NF-κB total protein expression (A) and IκBα phosphorylation (S32) relative to IκBα total protein expression (B) before (light gray bars) and after (dark gray bars) 7 days of bed rest in vastus lateralis skeletal muscle of healthy older adults (n = 6). Insets are representative immunoblot images. Line plots below figures represent individual means for males (M1–5) and female (F1). P values are indicated on figures. Values are presented as means ± SE.

