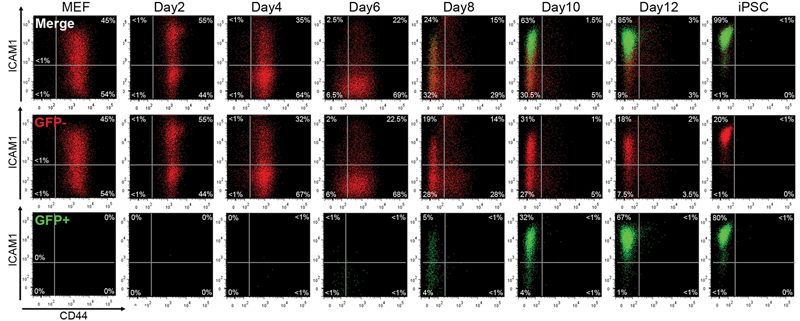
Figure 1. FACS analysis during 2° reprogramming of MEF with CD44/ICAM1 double staining.
Loss of CD44 expression was rapidly followed by ICAM1 upregulation and Nanog-GFP expression. By day 12 the majority of cells displayed an ICAM+/CD44− ESC-like profile. Red; Nanog-GFP− cells, Green; Nanog-GFP+ cells.

