
Figure 3.
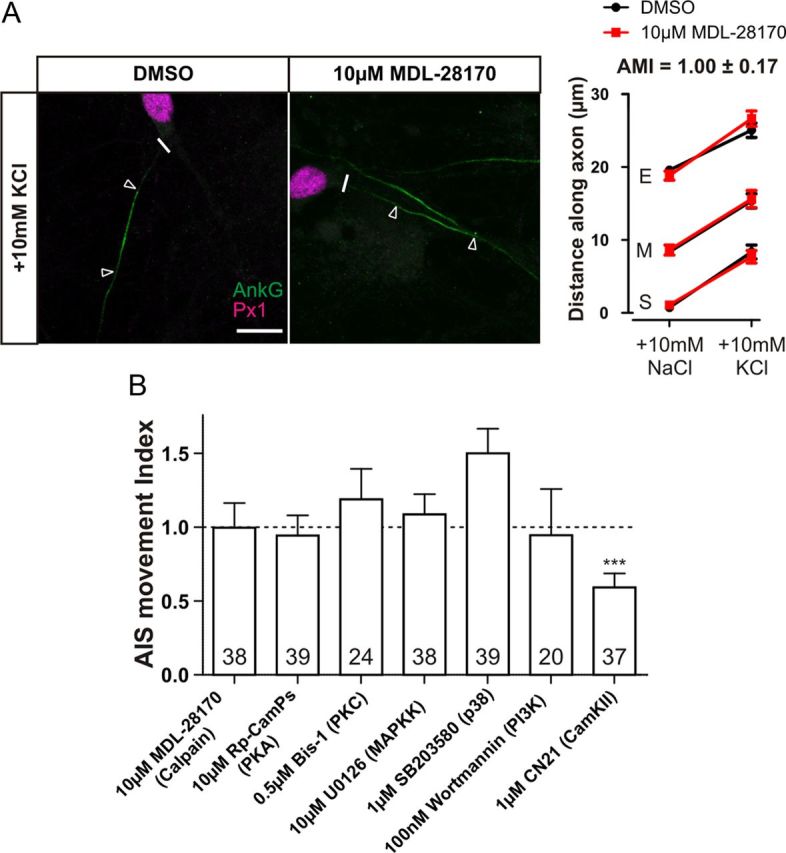
Screening possible calcium-activated targets downstream of L-type channels. A, Calpain is not involved in AIS relocation. Left, Example images of DGCs after 48 h depolarization in the presence of DMSO or 10 μm MDL-28170. Scale bar, 10 μm. Thick white line denotes axon start, and white triangles illustrate AIS location. AnkG, Ankyrin-G; Px1, prox1. Right, Mean ± SEM of AIS start (S), maximum (M), and end (E) position for each treatment and subsequent calculation of AMI. B, AMI mean ± SEM for possible downstream calcium-activated targets. ***p = 0.0001, single-sample t test of AMI vs 1. Numbers within bars show the number of cells for each experiment.