
Figure 5.
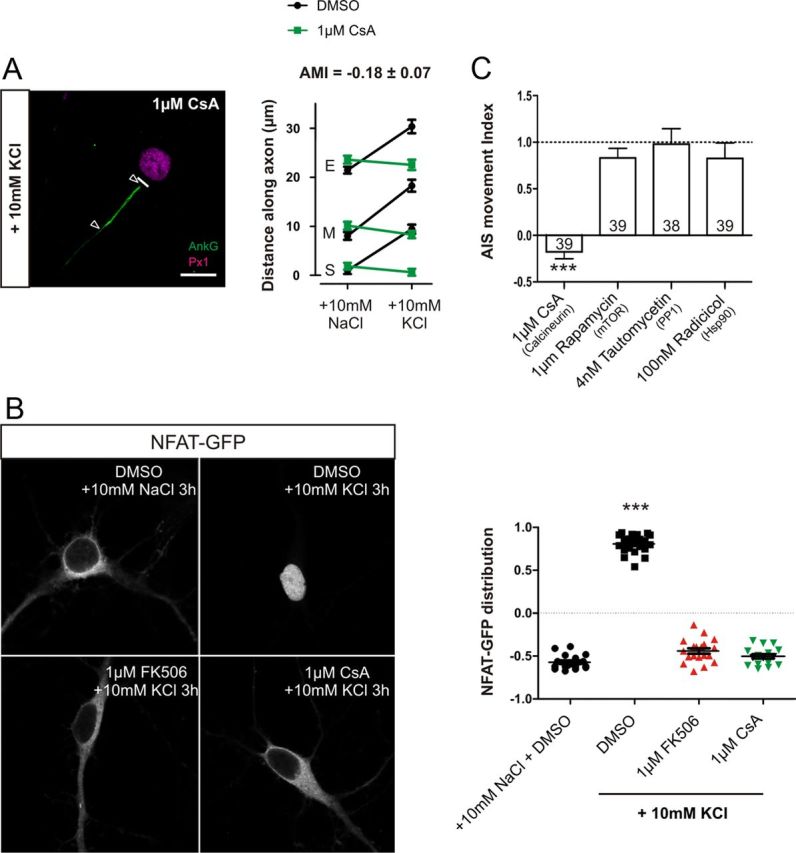
Inhibition of AIS relocation by FK506 is not a result of nonspecific effects. A, Calcineurin inhibition by CsA totally blocks AIS movement. Left, Example image of a DGC depolarized for 48 h in the presence of 1 μm CsA. Scale bar, 10 μm. Thick white line denotes axon start, and white triangles illustrate AIS location. AnkG, Ankyrin-G; Px1, prox1. Right, Mean ± SEM of AIS start (S), maximum (M), and end (E) position for each treatment and subsequent calculation of AMI. B, Both 1 μm FK506 and 1 μm CsA block nuclear translocation of NFAT–GFP after 3 h depolarization. Left, Sample images of NFAT–GFP localization from each treatment group. Right, NFAT–GFP nucleus/cytoplasm distribution in each treatment group. ***p < 0.0001, one-way ANOVA with Tukey's multiple comparison test. C, AMI mean ± SEM values for pharmacological experiments used to test calcineurin inhibitor secondary effects. ***p < 0.0001, single-sample t test of AMI vs 1. Numbers within bars show the number of cells for each experiment.