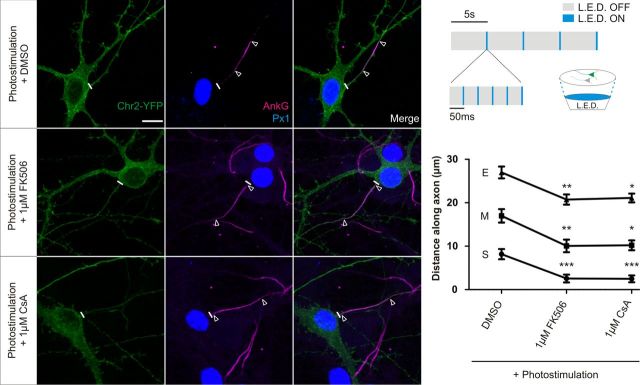
Figure 7.
Photostimulation-induced AIS relocation is blocked by calcineurin inhibitors. Top right, Diagram of LED setup and stimulation paradigm. Left, Example images of ChR2-expressing DGCs subjected to 48 h photostimulation in the presence of DMSO, 1 μm FK506, or 1 μm CsA. Scale bar, 10 μm. Thick white line denotes axon start, and white triangles illustrate AIS location. AnkG, Ankyrin-G; Px1, prox1. Bottom right, Mean ± SEM of AIS start (S), maximum (M), and end (E) position for ChR2-expressing DGCs photostimulated in each treatment. Kruskall-Wallis test with Dunn's multiple comparison for start, maximum, and end positions versus DMSO, *p < 0.05; **p < 0.01; ***p < 0.001.

