
Figure 9.
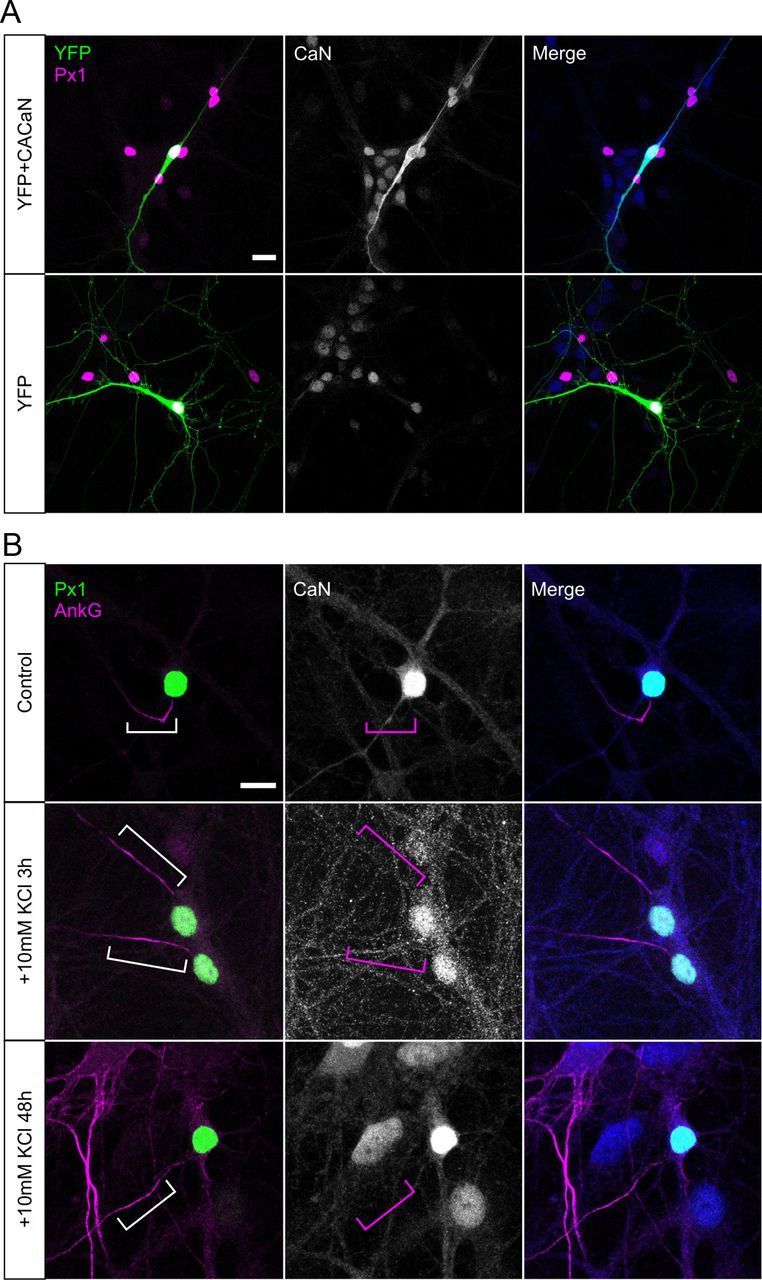
Calcineurin is not concentrated at the AIS. A, Example DGCs transfected with either CACaN + YFP (top) or YFP alone (bottom), labeled for calcineurin A. Scale bar, 20 μm. B, Example DGCs in control conditions (top) or depolarized with KCl for 3 h (middle) or 48 h (bottom). Scale bar, 10 μm. Brackets outline AIS location; note the lack of calcineurin staining in this region in all treatment groups. AnkG, Ankyrin-G; Px1, prox1; CaN, calcineurin.