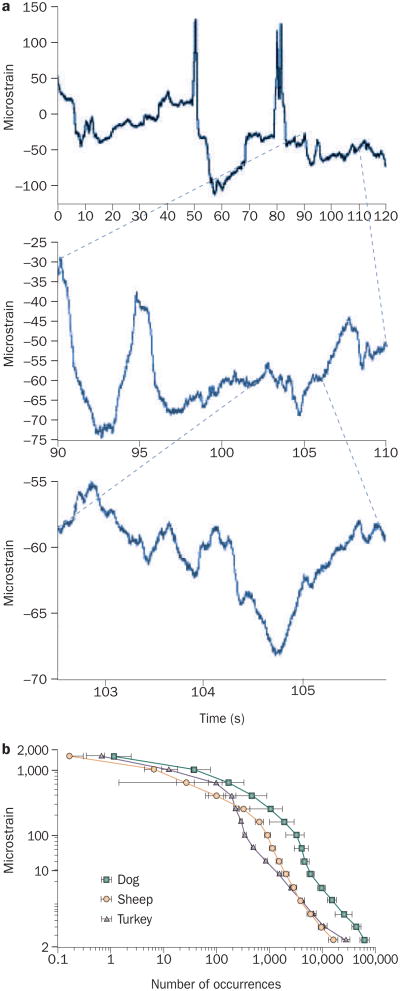
Figure 1.
Bone is subjected to a range of mechanical strains. a | A 2-minute recording from a strain gauge attached to a sheep tibia while the animal is standing (top panel) shows peak strains in the order of 200 microstrain. A 20-second section of that strain record (middle panel) shows peak strain events as large as 40 microstrain, occurring at a high frequency. Closer inspection of a 3-second period of the strain recording (bottom panel) illustrates events in the order of 5 microstrain occurring through the entire recording period. when the strain activity of a bone is recorded over a 12-hour period, it is clear that there are very few large strain events (>2,000 microstrain) and tens of thousands of small strain events (<10 microstrain). b | Strain recordings from the tibia of a diverse range of animals over a 12-hour period are remarkably similar. Reprinted from Journal of Biomechanics 33, Fritton, S. P., McLeod, K. J. and Rubin, C. T. Quantifying the strain history of bone: spatial uniformity and self-similarity of low-magnitude strains, 317–325 © (2000), with permission from Elsevier.

