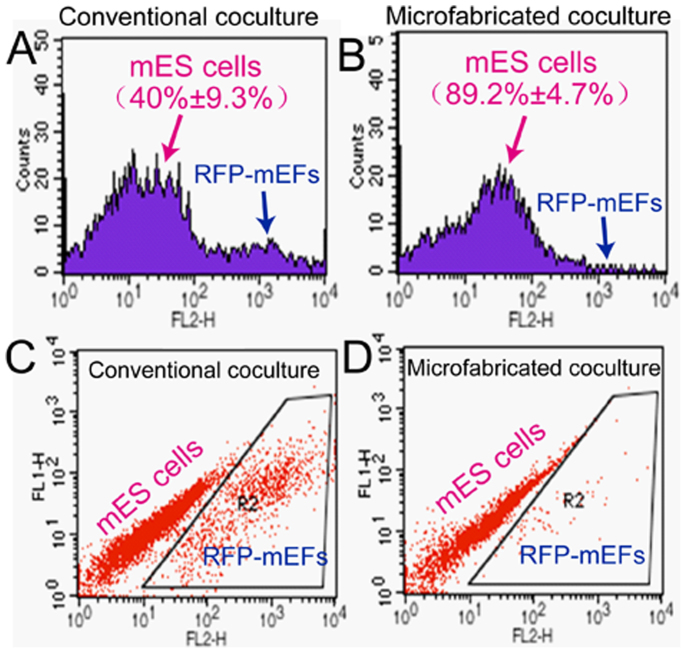
Figure 4. Quantitative analysis of the mES cells purities from conventional co-culture and microfabricated co-culture methods.
(A, C) shows the flow cytometric analysis of mES cells purities from conventional co-culture methods. (B, D) shows the flow cytometric analysis of mES cells purities from 3D-microfabricated co-culture methods. The mES cells were distinguished by red fluorescence of RFP-mEFs.

